Monitoring#
It's important to monitor the system health to detect problems before they occur, and also in the case that a problem occurs, to be able to quickly identify the root cause of the problem.
The following sections describe how to monitor the two type of servers:
- Application Server
- Database Server
In addition it includes a section that describes a Recommended Monitoring Strategy.
Application Server#
This section covers the monitoring of the following components:
- Distribution Transaction Coordinator (DTC)
- Message Queuing
- Load Balancing
- Application Server Performance Counters
- Microsoft Firewall
- Microsoft IIS
- Process Explorer
- Windows Event Log
Distribution Transaction Coordinator (DTC)#
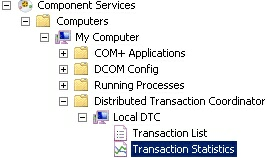
It is possible to use the Transaction Statistics in the Component Services snap-in to monitor the performance of Microsoft Distributed Transaction Coordinator (MS DTC) transactions. Transaction Statistics displays statistical information about the transactions in which a server participates. Transaction Statistics can be used to get an overview of MS DTC performance.
To view the Microsoft Distributed Transaction Coordinator (DTC) transaction statistics, it is necessary to perform the following sequence of steps:
- Open Component Services. To open Component Services, click Start. In the search box, type dcomcnfg, and then press Enter.
- In the console tree, double-click on the Distributed Transaction Coordinator folder, then doubleclick Local DTC, and finally click Transaction Statistics.
- You can view the state of the transactions under the Current, Aggregate, and Response Times nodes.
Example:
For more information about the Distribution Transaction Coordinator, refer to Distributed Transactions ⧉.
Message Queuing#
This section describes how to monitor the Critical Manufacturing message queuing. The system uses many queues for various purposes but the most important queue for the system operation is the CmfQueue. All the messages sent by the system are stored in this queue, and are processed by the system message bus.
Note
If the number of messages in this queue is constantly increasing, check the help section Troubleshooting in order to solve this problem.
Dead-letter Queue#
Undeliverable and expired transactional messages are stored in transactional dead-letter queues.
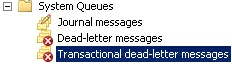
For more information, refer to the Dead-letter queues ⧉ page.
Note
Messages in this queue indicate a problem with the system message bus. In this case, check Troubleshooting to solve the problem.
For more information, refer to Installation Manual > Microsoft Message Queuing message queuing or Configuring Remote Queue also in the Installation Manual.
Load Balancing#
Monitoring the Discovery Service#
The Critical Manufacturing Discovery Service is a service in the WSFC all the best practices regarding cluster monitoring should be applied. There are different components monitored for availability:
- the cluster reports status of the cluster nodes, resource groups, and all resources.
- cluster nodes report the status of cluster groups on that node; state of other nodes; and state of resource groups.
- the cluster instances report the availability of the instance.
Info
Refer to the Host Manager page in the User Guide.
Application Server Performance Counters#
Windows provides an infrastructure called WMI (Windows Management Instrumentation) that allows the monitoring in real time of hardware performance indicators (counters). Counters are used to provide real time information about the performance of operating system, application, service, or drivers. The counter data can help to determine system bottlenecks and fine-tune system and application performance. The operating system, network, and devices provide counter data that an application can consume to provide users with a graphical view of how well the system is performing.
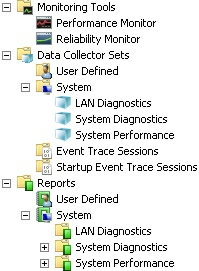
The Performance Counters are accessible in Monitoring Tools in Server Manager -> Administrative tools. Some of the typical Performance Counters that are useful to monitor in the Critical Manufacturing Application Servers are:
| Category | Counter | Description |
|---|---|---|
| Process | % Processor Time | Monitors the processor activity. |
| System | Processor Queue Length | Monitors the disk queue length – a big number indicates contention on the disks. |
| Memory | Available Memory | Monitors the available memory. A low number may indicate that a lot of paging activity is taking place. |
| Memory | Pages/Sec | Monitors the server paging. A low value is a sign of good health. |
Table: Application Server Performance Counters
A more comprehensive list of the most useful performance counters can be found in this link ⧉ (Performance Monitor Counters).
It's also possible to enable the WCF Performance counters in the Critical Manufacturing MES host by editing its app.config file. For more information, refer to the Server Manager ⧉.
Process Explorer#
Note
This section contains material from the following URL: http://en.wikipedia.org/wiki/Process_Explorer ⧉
The Process Explorer is a system monitoring and examination utility and can be used as the first step in debugging software or system problems. Process Explorer can be used to track down problems. For example, it provides a means to list or search for named resources that are held by a process or all processes. This can be used to track down what is holding a file open and preventing its use by another program. Or as another example, it can show the command lines used to start a program, allowing otherwise identical processes to be distinguished. Similar to Task Manager, it can show a process that is maxing out the CPU, but unlike Task Manager it can show which thread (with the call stack) is using the CPU – information that is not even available under a debugger.
Features:
- Hierarchical view of processes.
- Ability to display an icon and company name next to each process.
- Live CPU activity graph in the task bar.
- Ability to suspend selected process.
- Ability to raise the window attached to a process, showing it.
- Complete process tree can be killed.
- Interactively alter a service process' access security
- Interactively set the priority of a process
- Disambiguates service executables which perform multiple service functions. For example, when the pointer is placed over a svchost.exe, it will tell if it is the one performing automatic updates/secondary logon/etc., or the one providing RPC, or the one performing terminal services, and so on.
For more information and application download, refer to the page Process Explorer ⧉.
Windows Firewall#
The Windows Firewall with Advanced Security can be used to protect and monitor the computers on a network.
To start Windows Firewall with Advanced Security Monitoring, follow the sequence of steps:
- Click Start
- Click Control Panel
- Click System and Security
- Click Windows Firewall and then click on Advanced Settings
- Click on Monitoring and then click on Firewall
For more information, refer to Windows Firewall Monitoring ⧉.
Microsoft IIS#
Microsoft Internet Information Services (IIS) is used to host the Critical Manufacturing web applications.
For more information on how to monitor Microsoft Internet Information Services, refer to the article Monitoring IIS ⧉.
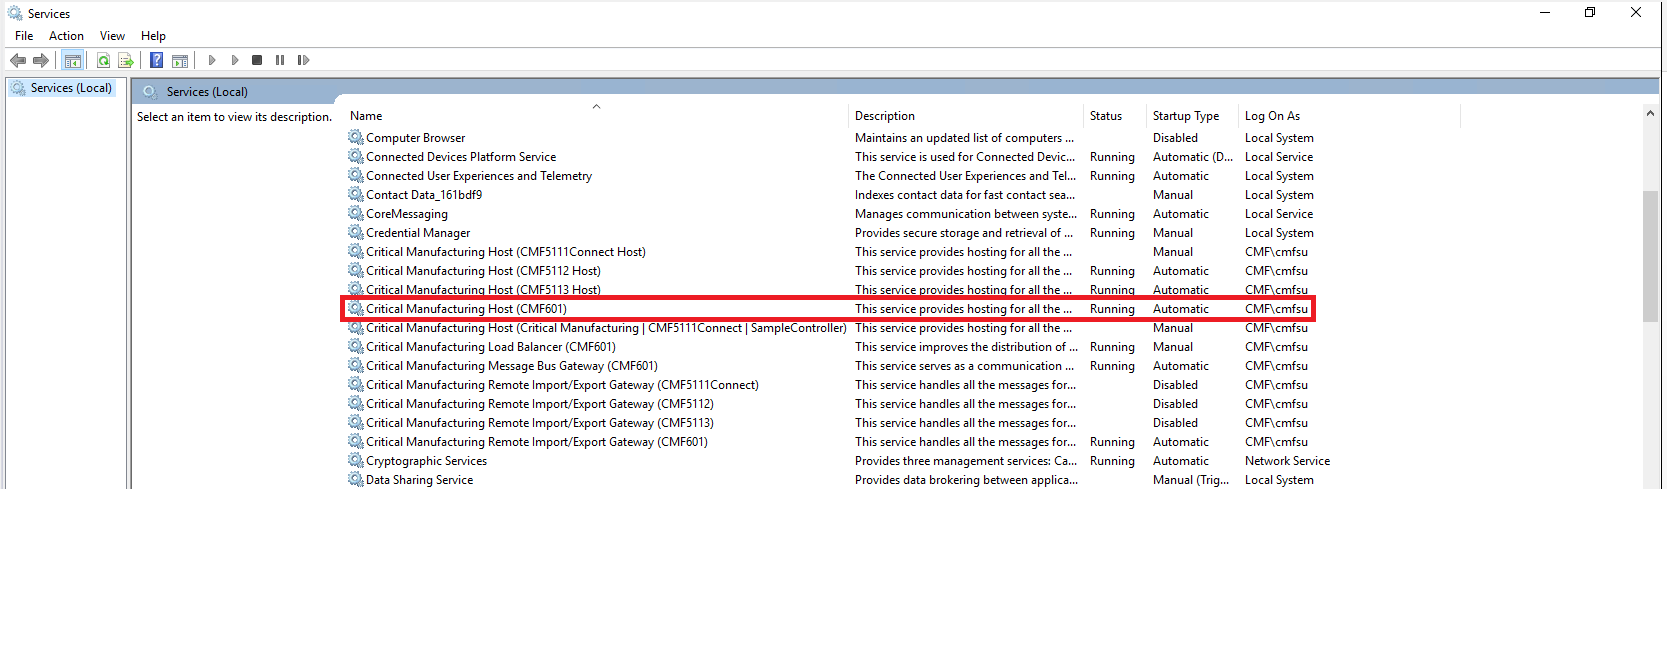
Managing Services#
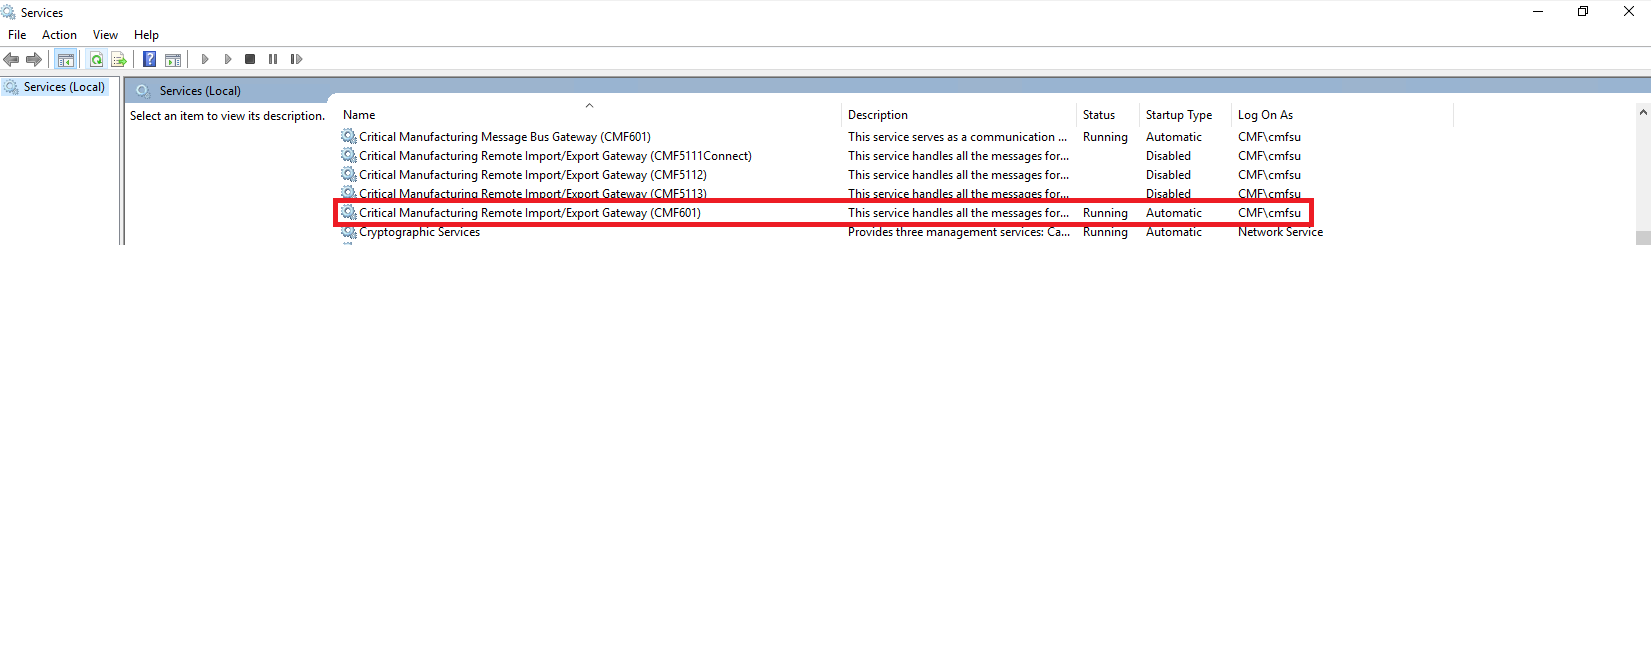
It's possible to check the current status of the Critical Manufacturing Foundation Service and Remote Import Export Service by accessing the Services manager, by pressing the start button, then running services.msc.
It's possible to manage the services (Start/Stop/Restart), simply by right-clicking on the service and choose the option desired.
Windows Event Log#
The Windows Event Log captures a variety of events of different severities. To start Windows Event Log, follow the sequence of steps:
- Click Start
- Type eventvwr.exe and then press Enter.
- Check the system for Errors and Warnings, primarily in the Application and System logs.
Database Server#
This section covers the following topics:
- Critical Manufacturing databases and database instances
- Data Collection
- SQL Server Management Studio
- Monitoring Events
- Database Server Performance Counters
Critical Manufacturing Databases and Database Instances#
A typical Critical Manufacturing MES installation consists of two Microsoft SQL ServerTM Database instances (Online and ODS).
The Online SQL Server Instance stores the MES database used for the runtime environment. The ODS SQL Server Instance stores the ODS and DWH databases used for long time storage, reporting and analytics.
Data Collection#
Microsoft SQL ServerTM provides a data collector that can be used to obtain and save data that is gathered from several sources. The data collector enables you to use data collection containers, which enable you to determine the scope and frequency of data collection on a computer that is running SQL Server.
For more information, refer to the Data Collection ⧉ page.
SQL Server Management Studio#
SQL Server Management Studio is a administration tool that enables the management of the Database Engine, Analysis Manager, and SQL Query Analyzer in one place, together with the ability to write Transact-SQL, MDX, XMLA, and XML statements.
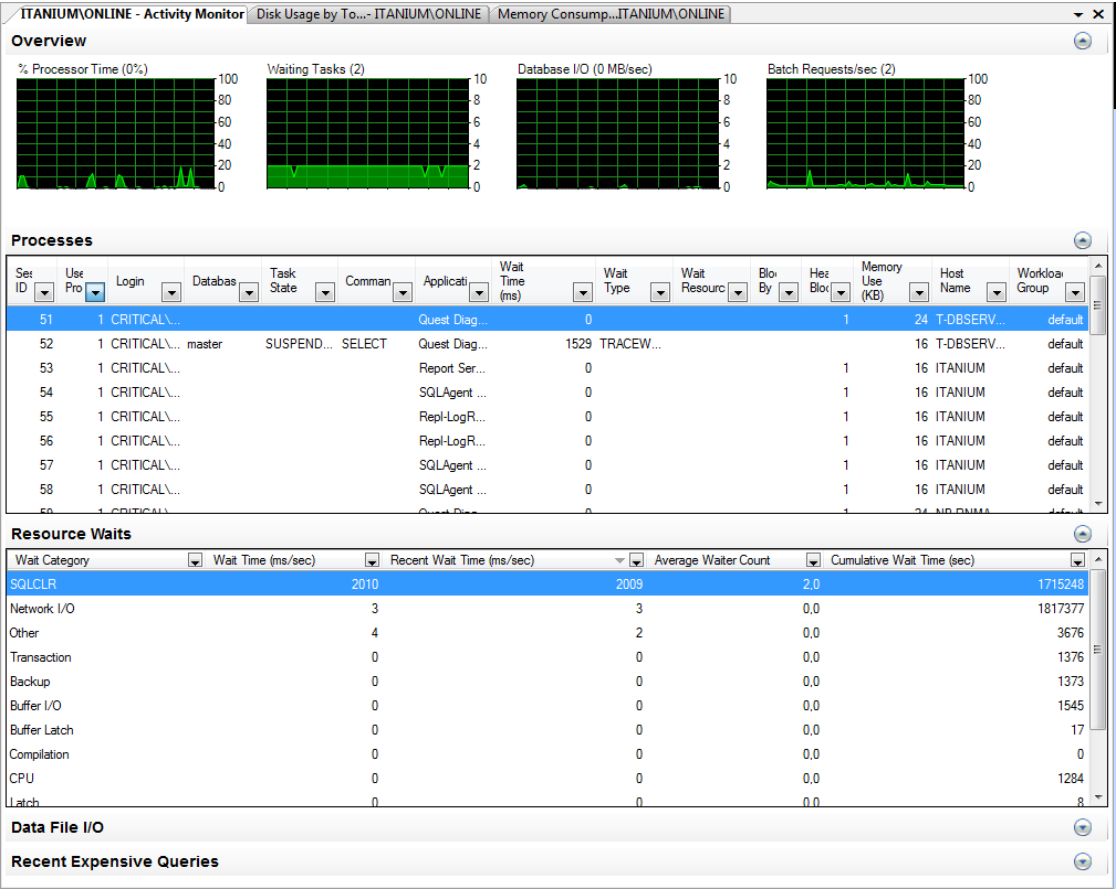
Special Administration Tools#
Perhaps one of the most interesting utility provided by SQL Server Management Studio at the instance level is the Activity Monitor. The Activity Monitor is accessible by connecting to the database instance with Administration privileges, right-clicking on the instance and selecting Activity Monitor. It provides a comprehensive dashboard about the status and health of the database instance as shown in the next image.
SQL Server Management Studio also provides a variety of reports at both the instance level and database level. It is only necessary to right-click on the instance or database, select the desired report as shown in the next picture.
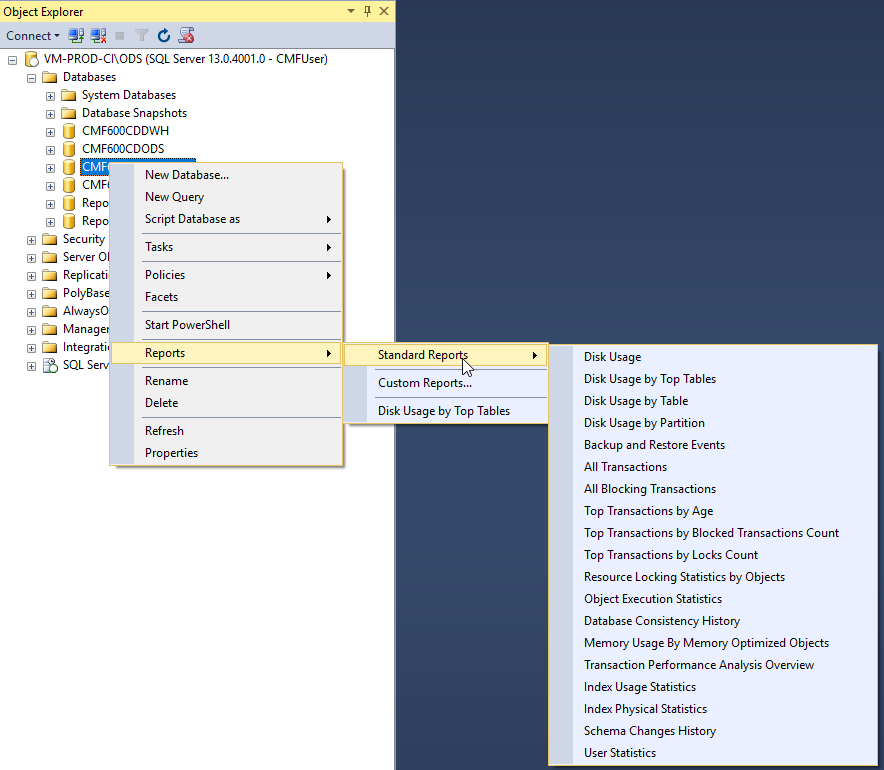
Info
These type of reports exist at both the instance level and database level. The number and type of reports vary depending on whether the selected object is an instance or a database.
The image below is a screenshot of an instance level Server Dashboard report.
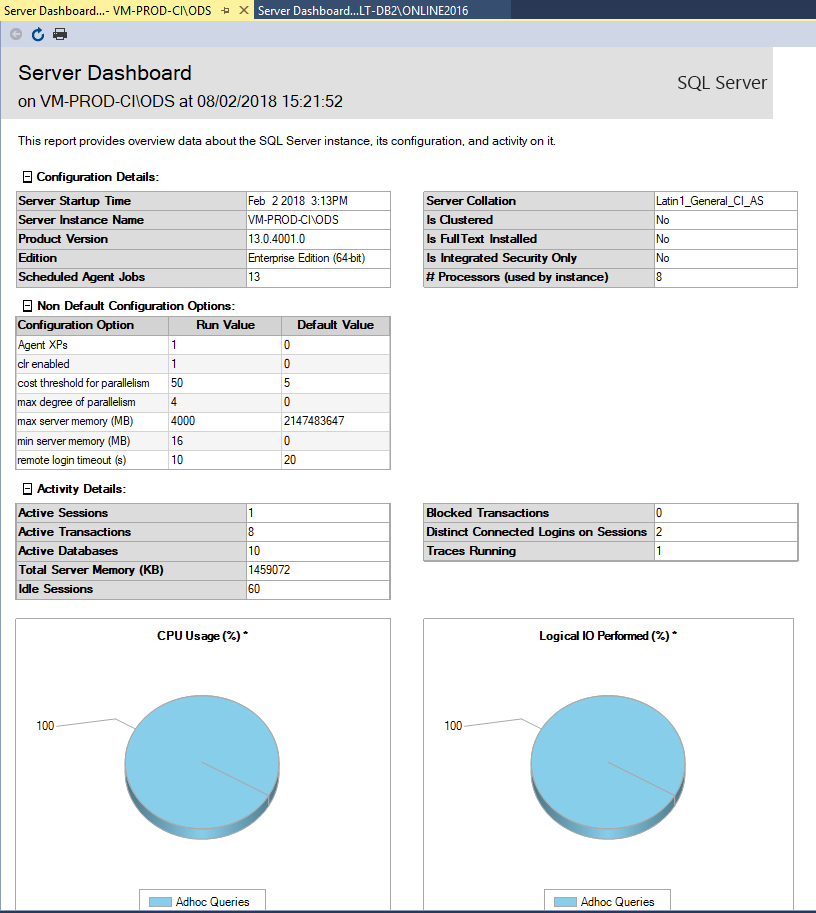
For more information, refer to the Microsoft SQL Server Management Studio ⧉ page.
Monitoring Events#
SQL ServerTM provides SQL Trace and event notifications to monitor events that occur in the Database Engine.
For more information, refer to the Monitoring Events ⧉ page.
Database Server Performance Counters#
Similar to the Application Server Performance Counters it is possible to instrument and monitor the hardware usage and performance of the Database Servers. Because databases are I/O intensive, it is also worth checking the network and disk activity. Some important I/O performance counters are:
| Category | Counter | Description |
|---|---|---|
| Network Interface | Bytes Total/sec | Monitors the network activity |
| PhysicalDisk | % Disk Time | Monitors the disk activity. |
| PhysicalDisk | Current Disk Queue Length | Monitors the disk queue length – a big number indicates contention on the disks |
Table: Database Server I/O Counters
In addition, SQL Server installs an array of database specific counters that can be used to monitor different performance indicators associated with SQL Server. Some of the typical Performance Counters that are useful to monitor a SQL Server database are:
| Category | Counter | Description |
|---|---|---|
| SQL Server | Databases | Provides information about a SQL Server database, such as the amount of free log space available or the number of active transactions in the database. There can be multiple instances of this object |
| SQL ServerTM | General Statistics | Provides information about general server-wide activity, such as the number of users who are connected to an instance of SQL Server |
| SQL ServerTM | Locks | Provides information about the individual lock requests made by SQL Server, such as lock time-outs and deadlocks. There can be multiple instances of this object |
| SQL ServerTM | Memory Manager | Provides information about SQL Server memory usage, such as the total number of lock structures currently allocated |
Table: Database Server Performance Counters
A comprehensive list of SQL Server performance counters can be found in the Using SQL Server Objects ⧉ page.
Recommended Monitoring Strategy#
This section describes the Critical Manufacturing MES's recommended monitoring strategy for a production environment based on best practices. The best practices can be summarized in the following two guidelines:
- Actively deploy a commercial monitoring system which supports the Simple Network Management Protocol (SNMP) to automate the monitoring procedures and to generate automatic system alerts.
- Monitor the trend of the system resources usage and system performance in a proactive and periodic manner
Deploying a Commercial Monitoring System#
A commercial monitoring system facilitates the configuration and automatic monitoring of the health of multiple hardware and software components which make part of a distributed application.
The next sub-sections describe the type of monitoring recommended for Application and Database Servers. There's also a small sub-section for the ERP integration monitoring in case it is being used.
Application Servers#
The set of components listed in the next table be should be subjected to automatic monitoring at each application server.
| Components | Description | Healthy State |
|---|---|---|
| Critical Manufacturing («CM MES instance») Host Service State | This is the main Critical Manufacturing MES application server process | Running |
| Critical Manufacturing Remote Import/Export Gateway («CM MES instance») | This process is used for exporting and importing data with other CM MES instances. It can be critical if export/import between CM MES instances is used, otherwise it’s not critical | Running |
| Internet Information Server (IIS) Service State | This is the web server process | Running |
| The IIS Web Site associated with the Critical Manufacturing MES application (e.g.: Default Web Site) Status | This is the web site hosted by the web server | Started |
| Microsoft Distributed Transaction Coordinator Service State | This is a critical component required for transaction handling | Running |
| Microsoft Message Queuing Service State | This is a critical component required for messaging | Running |
Table: Application Server components
In addition, it’s recommended to make the checks listed in the table below to ensure the availability and responsiveness of the system even in case that all components are up and running.
| Test | Test Procedure Description |
|---|---|
| Test the Critical Manufacturing MES service responsiveness at a particular server. | Make a get (test) API call to the Critical Manufacturing MES application server. The server must respond correctly within a reasonable amount of time. |
Table: System availability and responsiveness
The set of performance counters listed in the next table should be included in the automatic monitoring system for the application servers.
| Area | Parameter | WMI Counter | Healthy State |
|---|---|---|---|
| CPU | CPU Utilization | Processor\% Processor Time (_Total) | < 80% (average) |
| CPU | Number of threads in the processor queue | System\Processor Queue Length | |
| Disk | Disk Transfers | Logical Disk\Disk Transfers/sec (_Total) | Under 80% of its capacity (average) |
| Disk | Free Disk Space | Logical Disk\% Free Space (_Total) | > 20% |
| Memory | Available Physical Memory | Memory\ Memory\Available Mbytes | |
| Memory | Memory hard page faults | Memory\Pages per Second | |
| Memory | Page File Utilization | Paging File\ % Usage (_Total) | < 80% (average) |
| Memory | Virtual Memory Utilization | Memory\% Committed Bytes in Use | < 80% (average) |
| MSMQ | Microsoft Message Queue Journal and Dead-Letter Queue | MSMQ\Messages In Queue (Computer Queues) | |
| Network | Network Interface\Bytes Total/Sec | Network Interface\Bytes Total/Sec | Under 80% of its capacity (average) |
| Network | Network Interface\Output Queue Length | Network Interface\Output Queue Length | |
| Transaction Management | Aborted Transactions | Distributed Transaction Coordinator\Aborted Transactions / sec | |
| Transaction Management | Committed Transactions | Distributed Transaction Coordinator\Committed Transactions / sec | |
| Transaction Management | Response Time -- Average | Distributed Transaction Coordinator\ Response Time -- Average | |
| Transaction Management | Transactions/sec | Distributed Transaction Coordinator\ Transactions/sec |
Table: Automatic Application Server performance counters to monitor
Database Servers#
The set of components listed in the next table be subject to automatic monitoring at each database server.
| Components | Description | Healthy State |
|---|---|---|
| SQL Server «CM MES Online Database» Service State | This is the online Critical Manufacturing database server instance | Running |
| SQL Server «CM MES ODS Database» Service State | This is the ODS Critical Manufacturing database server instance. The ODS can run in the same instance as the online database server instance | Running |
| SQL Server Agent «CM MES Online Database» | This is a SQL Server service that executes scheduled administrative tasks for the online database server instance | Running |
| SQL Server Agent «cCM MES ODS Database» | This is a SQL Server service that executes scheduled administrative tasks for the ODS database server instance. The ODS can run in the same instance as the online database server instance | Running |
| SQL Server «CM MES Data Warehouse Database» Analysis Services Service | State This is the Critical Manufacturing Data Warehouse analysis services server | Running |
| SQL Server Reporting Services «CM MES ODS Database» | This is the SQL Server service which is used for reporting purposes | Running |
| SQL Server Browser | A secondary service that supports browsing and discovery of SQL Server instances and services | Running |
| SQL Server Integration Services | A service used for SQL Server data integration and workflow applications | Running |
| SQL Server VSS Writer | A service that allows backups to be performed online | Running |
| Sentinel LDK License Manager | This is a licensing component which is used to license the Critical Manufacturing MES Scheduling module. It is typically installed in the database servers for high-availability purposes | Running |
Table: Database Server performance counters to monitor
In addition, it’s recommended to check the availability and responsiveness of the database even in case that all components are up and running. Furthermore, it’s also necessary to check the execution state of a set of critical database jobs. These recommended tests are described in the table below.
| Test | Test Procedure Description |
|---|---|
| Test the database responsiveness at a particular database server instance | Execute a SQL Select statement. The database server must respond correctly within a reasonable amount of time |
| Test the state of the following jobs in the Online Database: {Database name} Data Replication | Check if job status is Executing |
| Test the state of the following jobs in the Online Database: {DatabaseName} Delete History Tables {DatabaseName} Execute Enqueued Commands {DatabaseName} Execute ODS Enqueued Commands {DatabaseName} Purge Entity Types {DatabaseName} Reseed Identity columns {DatabaseName} Terminate Expired Chart Data Points | Check that the last Run Outcome is Succeeded for all jobs |
| Test the state of the following jobs in the ODS Database: {DatabaseName} Export Terminated Materials XML {DatabaseName} MainTablePartitioning {DatabaseName} ManagePartitions {DatabaseName} Enqueued Commands in ODS | Check that the last Run Outcome is Succeeded for all jobs |
| Test the state of the following jobs in the DWH Database: {DatabaseName} Critical Manufacturing Data Warehouse {DatabaseName} Critical Manufacturing DWH Partitioning Management | Check that the last Run Outcome is Succeeded for all jobs |
Table: Database Server jobs to monitor
The set of performance counters listed in the next table must be subject to automatic monitoring at the database servers.
| Area | Parameter | WMI Counter | Healthy State |
|---|---|---|---|
| CPU | CPU Utilization | Processor\ % Processor Time(_Total) | < 80% (average) |
| CPU | Number of threads in the processor queue | System\Processor Queue Length | |
| Disk | Disk Transfers | Logical Disk\ Disk Transfers/sec (_Total) | Under 80% of its capacity (average) |
| Disk | Free Disk Space | Logical Disk\ % Free Space (_Total) | > 20% |
| Memory | Available Physical Memory | Memory\ Memory\ Available Mbytes | |
| Memory | Memory hard page faults | Memory\ Pages per Second | |
| Memory | Page File Utilization | Paging File\ % Usage (_Total) | < 80%(average) |
| Memory | Virtual Memory Utilization | Memory\ % Committed Bytes in Use | < 80% (average) |
| MSMQ | Microsoft Message Queue Journal and Dead-Letter Queue | MSMQ\Messages In Queue (Computer Queues) | |
| Network | Network Interface\Bytes Total/Sec | Network Interface\Bytes Total/Sec | Under 80% of its capacity (average) |
| Network | Network Interface\Output Queue | Length Network Interface\ Output Queue Length | |
| Transaction Management | Aborted Transactions | Distributed Transaction Coordinator\ Aborted Transactions/sec | |
| Transaction Management | Committed Transactions | Distributed Transaction Coordinator\ Committed Transactions / sec | |
| Transaction Management | Response Time - Average | Distributed Transaction Coordinator\ Response Time - Average | |
| Transaction Management | Transactions/sec | Distributed Transaction Coordinator Transactions/sec |
Table: Database Server performance counters to monitor
In addition to the performance counters above, it’s recommended to add the following performance counters for each database server instance. Each server instance provides a collection of WMI counters that start with MSSQL${Database Instance Name}.
| Parameter | Description | WMI Counter |
|---|---|---|
| Batch Requests/Sec | Batch Requests/Sec measures the number of batches SQL Server is receiving per second. This counter is a good indicator of how much activity is being processed by your SQL Server box. The higher the number, the more queries are being executed on your box. Like many counters, there is no single number that can be used universally to indicate your machine is too busy. Today’s machines are getting more and more powerful all the time and therefore can process more batch requests per second. You should review this counter over time to determine a baseline number for your environment | MSSQL${Database Instance Name}:SQL Statistics\Batch Requests/sec |
| Buffer cache hit ratio | The buffer cache hit ratio counter represents how often SQL Server is able to find data pages in its buffer cache when a query needs a data page. The higher this number the better, because it means SQL Server was able to get data for queries out of memory instead of reading from disk. You want this number to be as close to 100 as possible. Having this counter at 100 means that 100% of the time SQL Server has found the needed data pages in memory. A low buffer cache hit ratio could indicate a memory problem | MSSQL${Database Instance Name}:Buffer Manager\Buffer cache hit ratio |
| Buffer page life expectancy | The page life expectancy counter measures how long pages stay in the buffer cache in seconds. The longer a page stays in memory, the more likely SQL Server will not need to read from disk to resolve a query. You should watch this counter over time to determine a baseline for what is normal in your database environment. Some say anything below 300 (or 5 minutes) means you might need additional memory | MSSQL${Database Instance Name}:Buffer Manager\Page life expectancy |
| Checkpoint Pages/Sec | The checkpoint pages per second counter measures the number of pages written to disk by a checkpoint operation. You should watch this counter over time to establish a baseline for your systems. Once a baseline value has been established you can watch this value to see if it is climbing. If this counter is climbing, it might mean you are running into memory pressures that are causing dirty pages to be flushed to disk more frequently than normal | MSSQL${Database Instance Name}:Buffer Manager\Checkpoint pages/sec |
| Lock Waits/Sec | In order for SQL Server to manage concurrent users on the system, SQL Server needs to lock resources from time to time. The lock waits per second counter tracks the number of times per second that SQL Server is not able to retain a lock right away for a resource. Ideally you don't want any request to wait for a lock. Therefore you want to keep this counter at zero, or close to zero at all times | MSSQL${Database Instance Name}: Locks\Lock Waits/sec (_Total) |
| Page Splits/Sec | This counter measures the number of times SQL Server had to split a page when updating or inserting data per second. Page splits are expensive, and cause your table to perform more poorly due to fragmentation. Therefore, the fewer page splits you have the better your system will perform. Ideally this counter should be less than 20% of the batch requests per second | MSSQL${Database Instance Name}:Access Methods\Page Splits/sec |
| Processes Blocked | The processes blocked counter identifies the number of blocked processes. When one process is blocking another process, the blocked process cannot move forward with its execution plan until the resource that is causing it to wait is freed up. Ideally you don't want to see any blocked processes. When processes are being blocked you should investigate | MSSQL${Database Instance Name}:General Statistics\Processes blocked |
| SQL Compilations/Sec | The SQL Compilations/Sec measure the number of times SQL Server compiles an execution plan per second. Compiling an execution plan is a resource-intensive operation. Compilations/Sec should be compared with the number of Batch Requests/Sec to get an indication of whether or not complications might be hurting your performance. To do that, divide the number of batch requests by the number of compiles per second to give you a ratio of the number of batches executed per compile. Ideally you want to have one compile per every 10 batch requests | MSSQL${Database Instance Name}:SQL Statistics\SQL Compilations/Sec |
| SQL Re-Compilations/Sec | When the execution plan is invalidated due to some significant event, SQL Server will recompile it. The Re-compilations/Sec counter measures the number of time a re-compile event was triggered per second. Re-compiles, like compiles, are expensive operations so you want to minimize the number of recompilations. Ideally you want to keep this counter less than 10% of the number of Compilations/Sec | MSSQL${Database Instance Name}:SQL Statistics\SQL ReCompilations/Sec |
| User Connections | The user connections counter identifies the number of different users that are connected to SQL Server at the time the sample was taken. You need to watch this counter over time to understand your baseline user connection numbers. Once you have some idea of your high and low water marks during normal usage of your system, you can then look for times when this counter exceeds the high and low marks. If the value of this counter goes down and the load on the system is the same, then you might have a bottleneck that is not allowing your server to handle the normal load. Keep in mind though that this counter value might go down just because less people are using your SQL Server instance | MSSQL${Database Instance Name}:General Statistics\User Connections |
Table: Database Server WMI counters to monitor
ERP Integration#
ERP integration consists in the exchange of messages between Critical Manufacturing MES and the ERP. These messages are persisted in the system in the ERP Entry object. An easy way to monitor the health of the ERP Integration is to check, using a query, for active ERPEntry object instances in state Failed. Other states that can be checked for statistical purposes but do not affect the health of the system are: Received, Processed and Processing.
Monitoring Trends#
It’s important to understand critical trends in the system about resource usage and consumption as well as the system performance in a proactive and periodical manner. Regarding hardware resources, it’s necessary to compare from a reference period (baseline), how the usage has changed:
- CPU Utilization
- Memory Utilization
- Network Utilization
- Disk Space Utilization (mainly relevant for the database servers)
From a performance point of view, it’s also important to analyze how the system latency compares to the latency from a previous reference period.
Critical Manufacturing MES comes with a Service Performance standard report that lists the top services by latency (sorted by average duration). If the performance for a particular service starts to degrade considerably, it deserves a special investigation. If it turns out to be an issue related with the Critical Manufacturing MES standard product, please contact the Critical Manufacturing MES support team.