Grafana#

Warning
Grafana only works in containerized environments.
Overview#
The Grafana widget is used within Critical Manufacturing MES but your original Grafana dashboard is initially created in a separate external page.
Warning
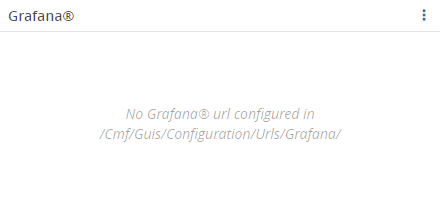
Given that Grafana is a server that can be deployed within the realm of the current customer environment (in a separate container sharing the same network and environment stack) or in an autonomous installation to be used by multiple environments, a configuration key is required to indicate the proper URL to be used for this specific environment. That key is /Cmf/Guis/Configuration/Urls/Grafana/ and should hold the value for the current Grafana server location (example: https://grafanaserver.companydomain.com:443/grafana). If the configuration entry is not filled in, the widget will display an error:
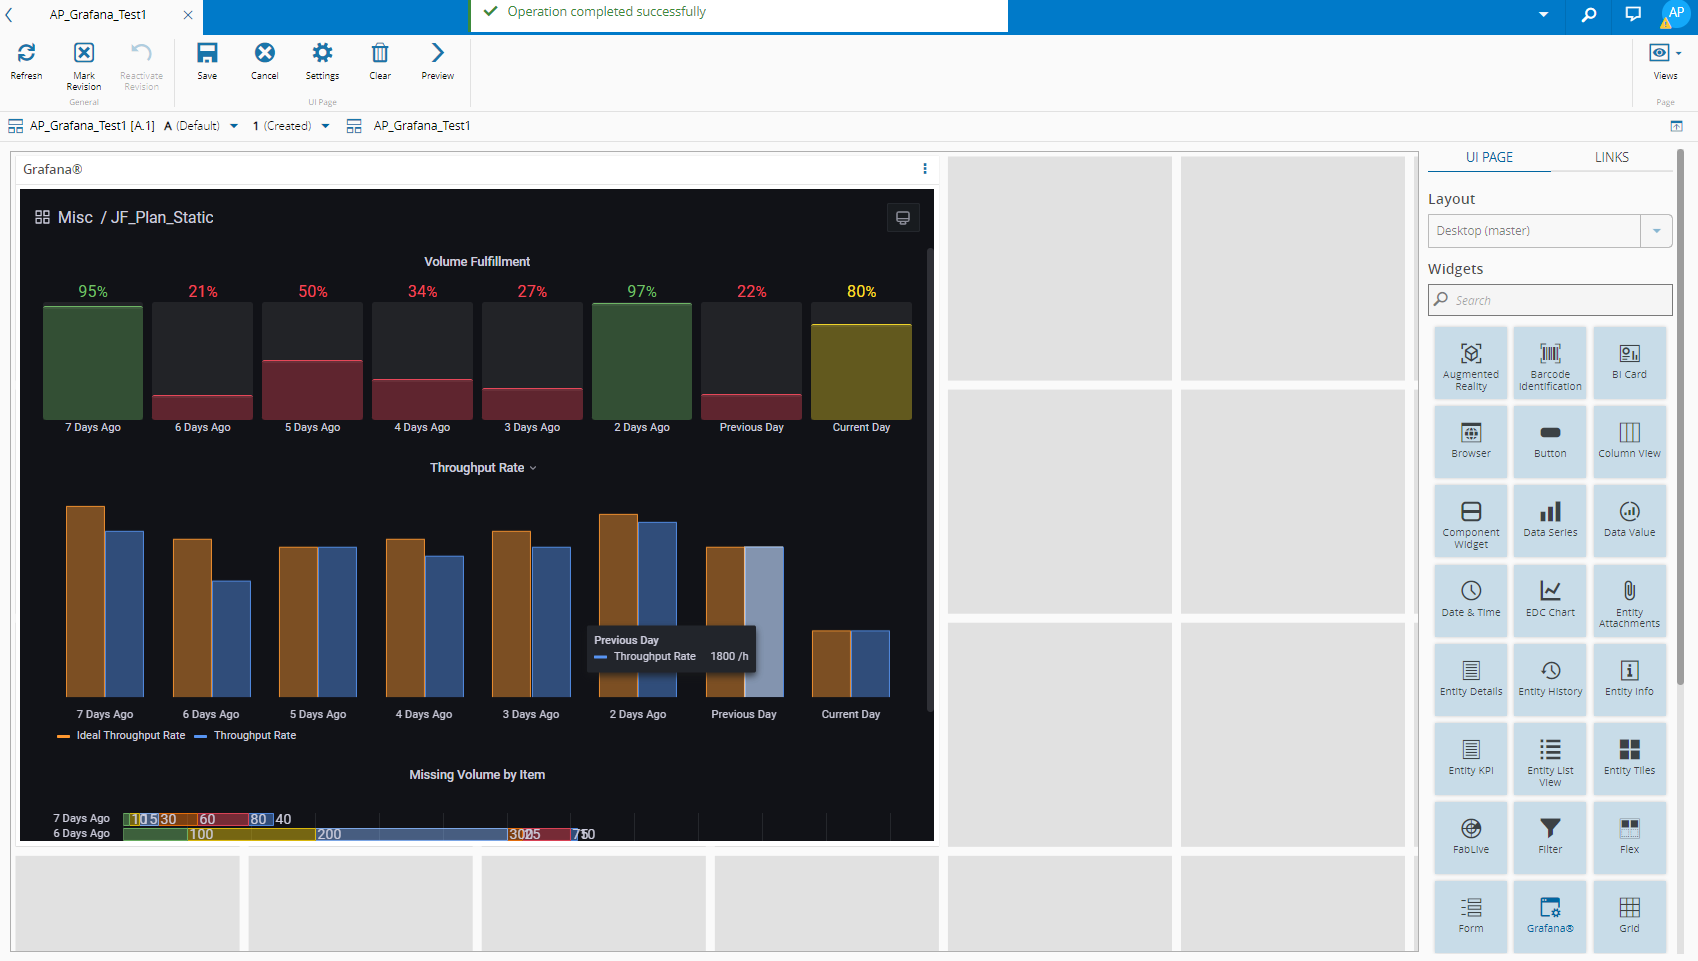
To use the Grafana widget in a UI Page, follow the steps below:
-
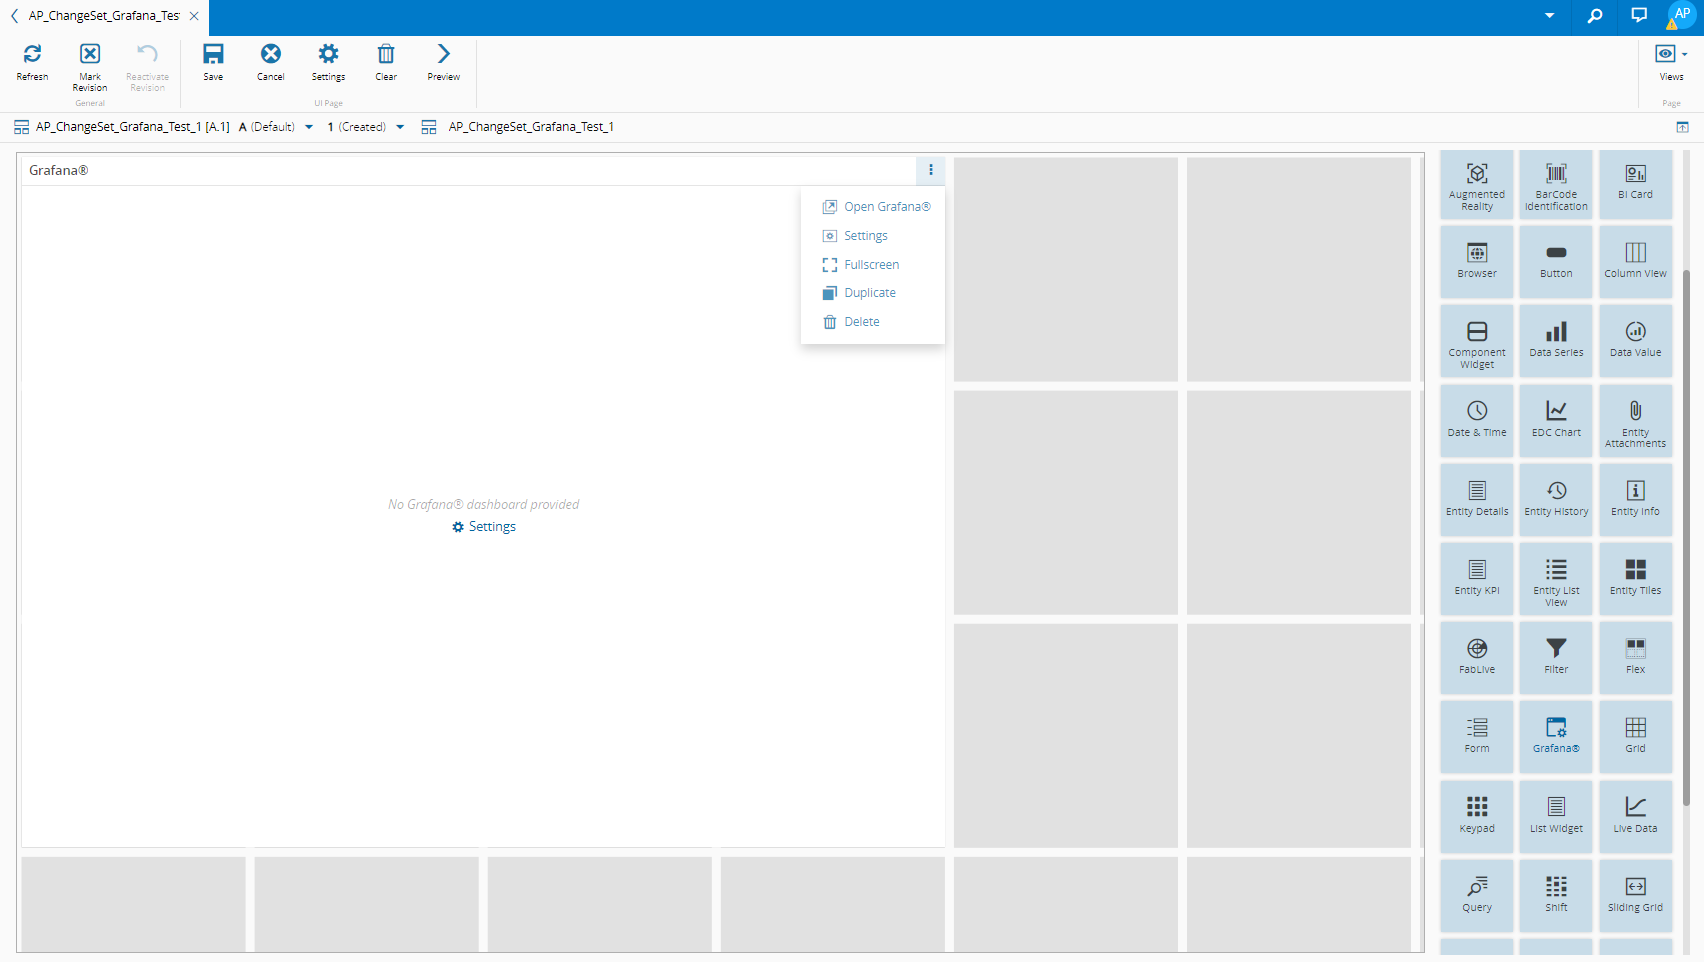
Drag and drop the Grafana widget into the desired place, expand it as needed, and then select Open Grafana:
-
The Grafana entry page looks like this:

Note
This page is very important because in the Need help? section you can access Documentation ⧉ and other useful links to help you start creating your Grafana dashboard.
-
Create your dashboard in Grafana and copy its address.
-
In the created UI Page, select Settings in the More dropdown of the Grafana widget:
-
Select the Setup tab and paste the complete address of your recently created Grafana dashboard in Dashboard Url:
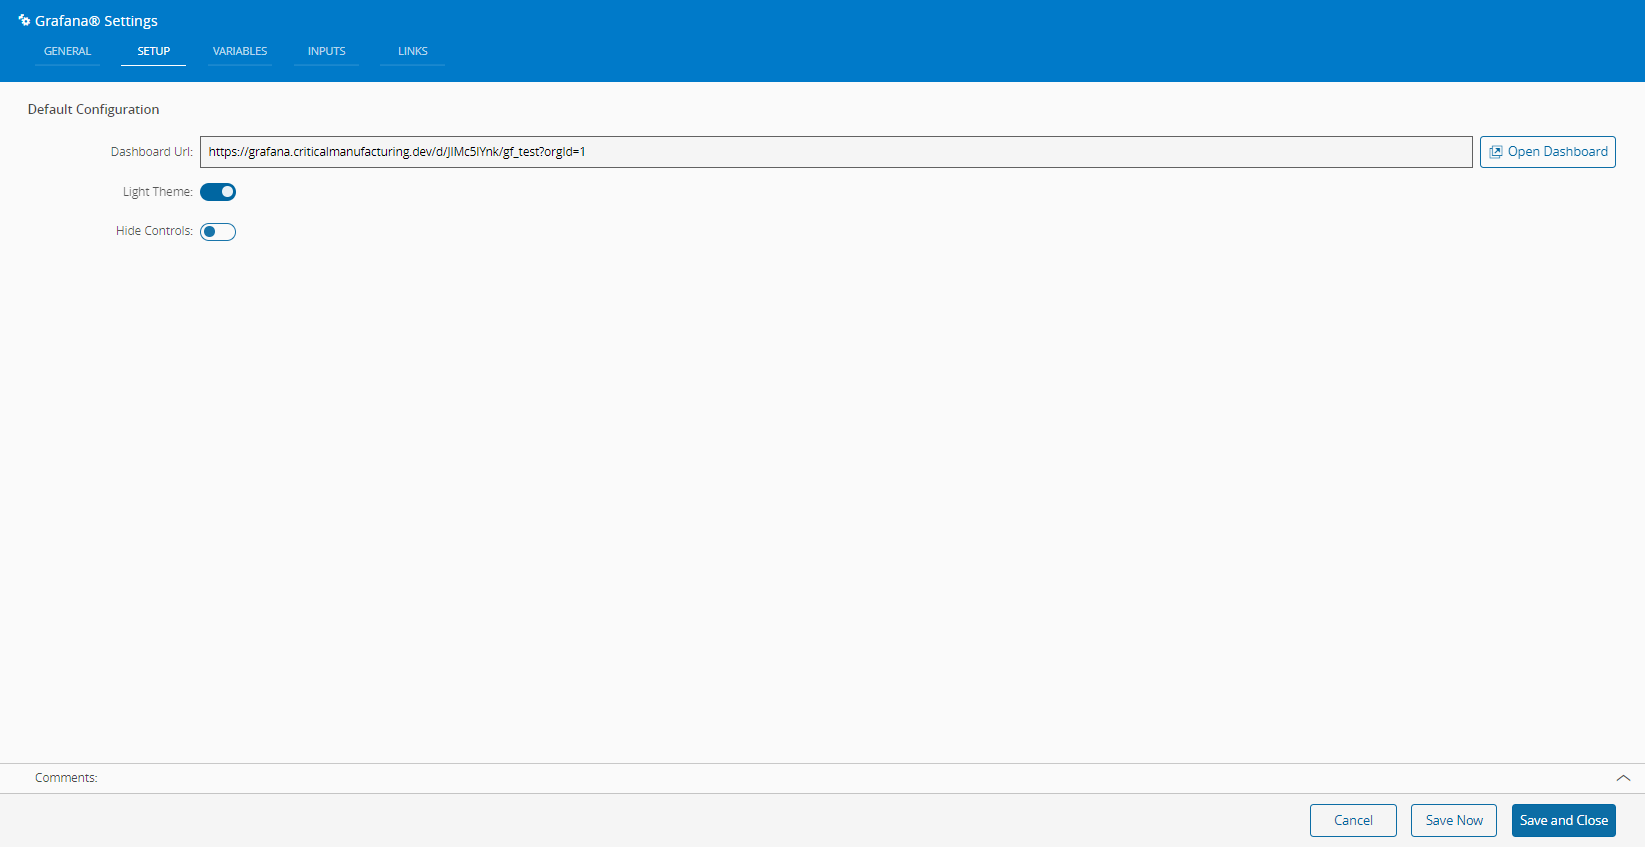
In the Setup tab you can also select between a light and a dark theme and whether or not to hide the controls.
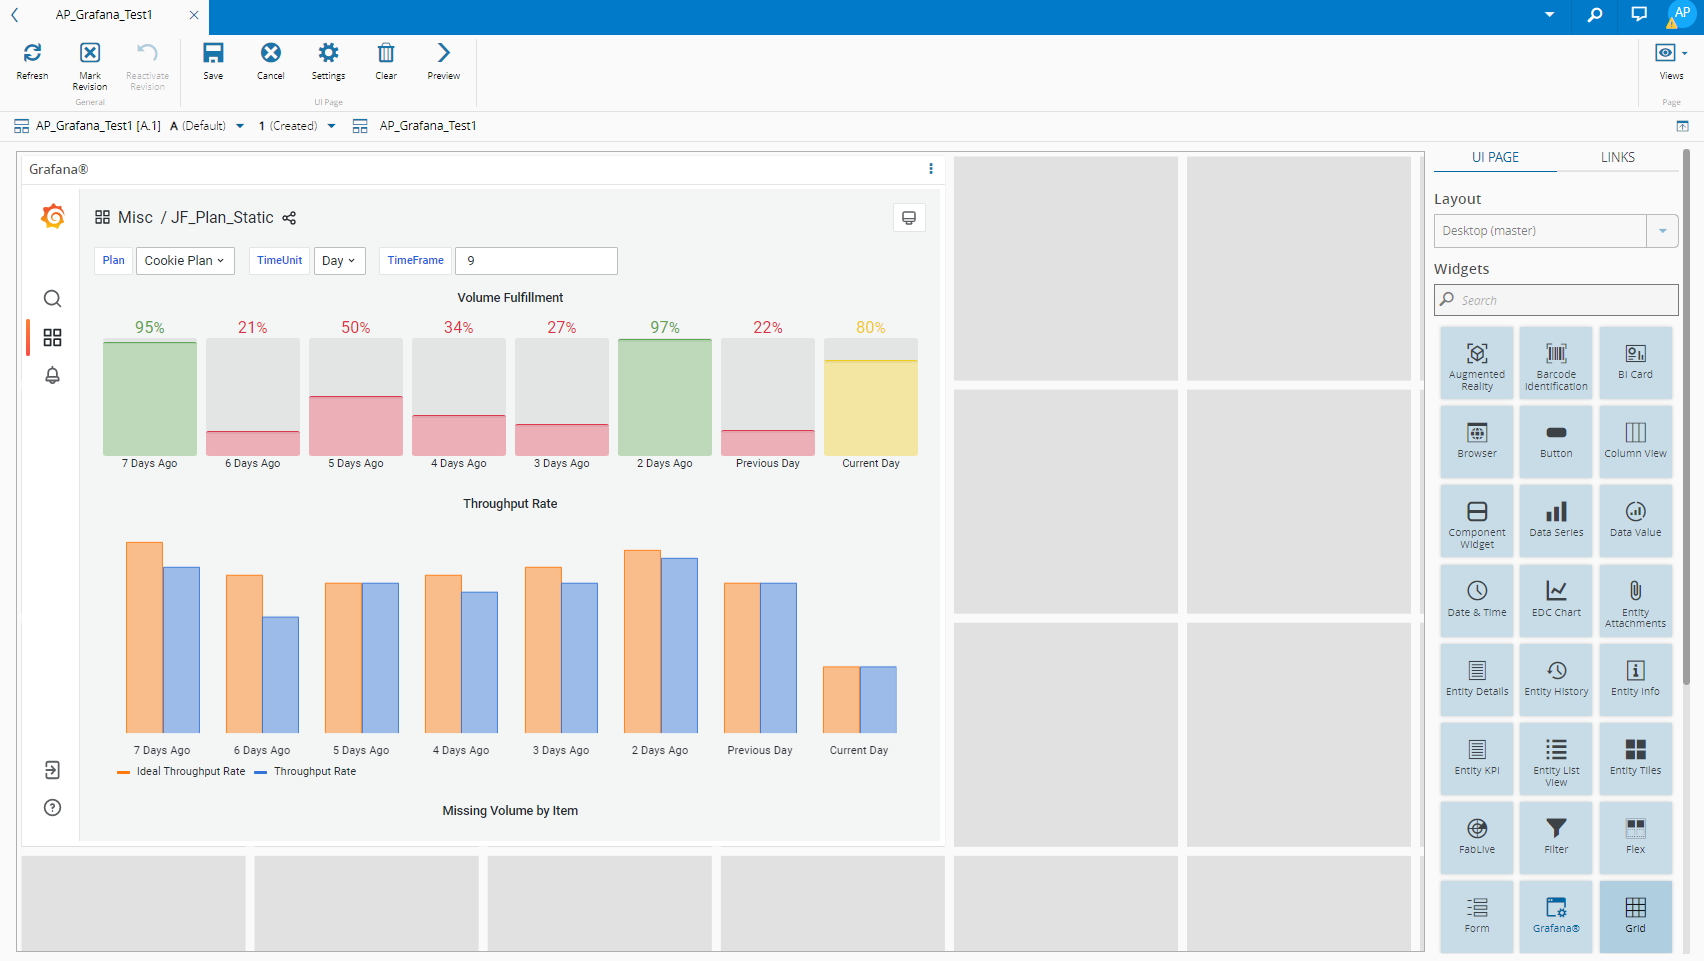
Grafana with a light theme and the controls bar on the left:
Grafana with a dark theme and no controls bar:
-
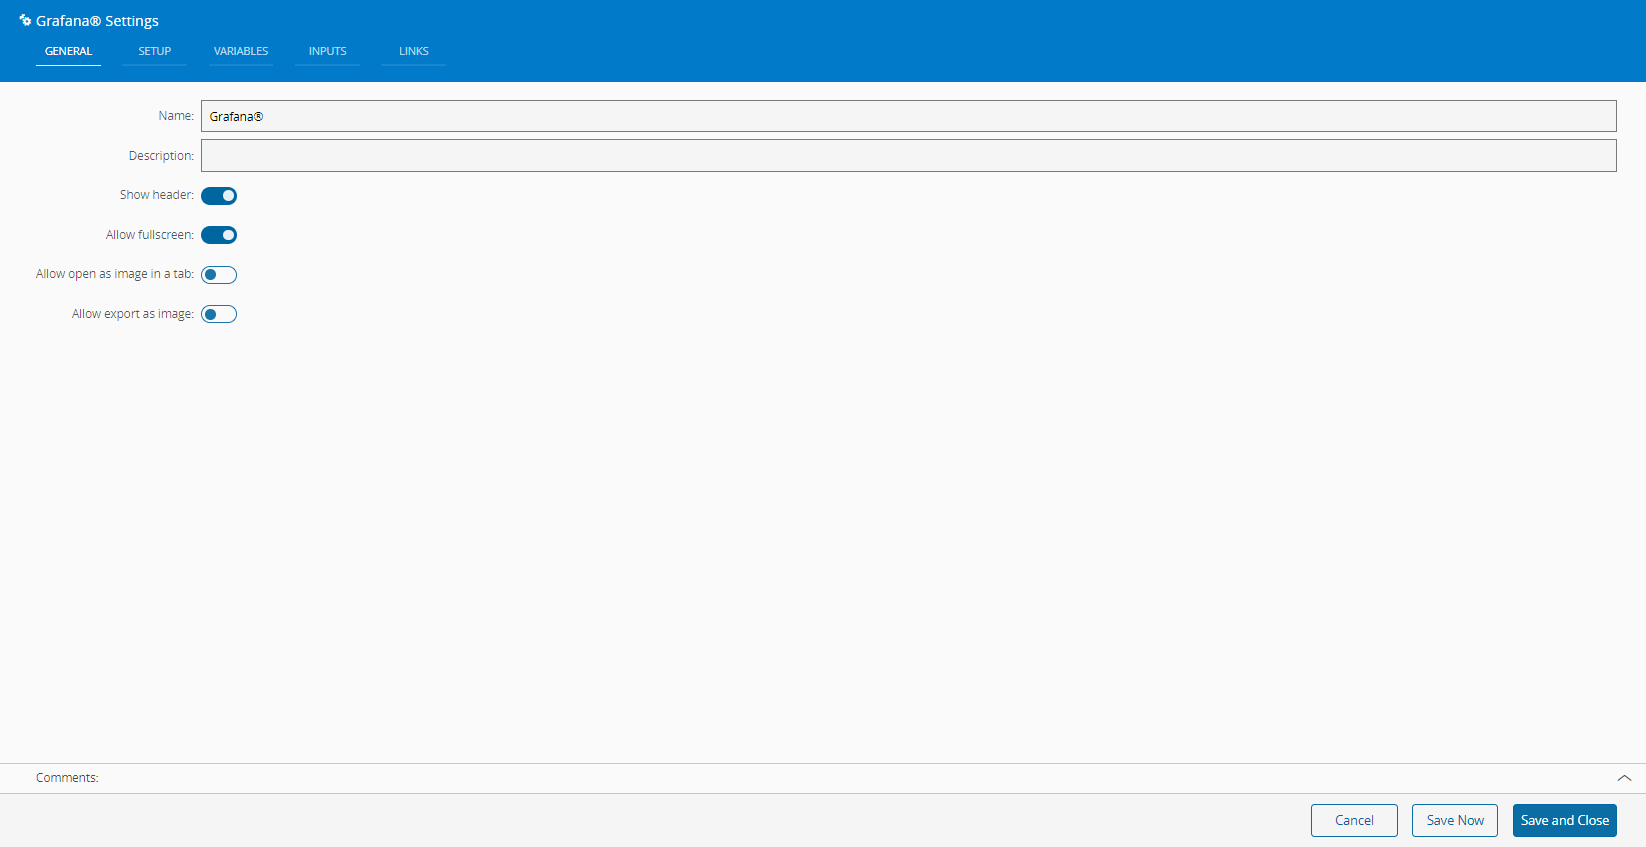
In the General tab, provide a name for the widget (Grafana by default), a description, specify whether it should display the header, if the user can activate the fullscreen mode, and also if it should allow to open in a tab or export as an image:
-
In the Variables tab you can or override the variables created in Grafana along with their details:
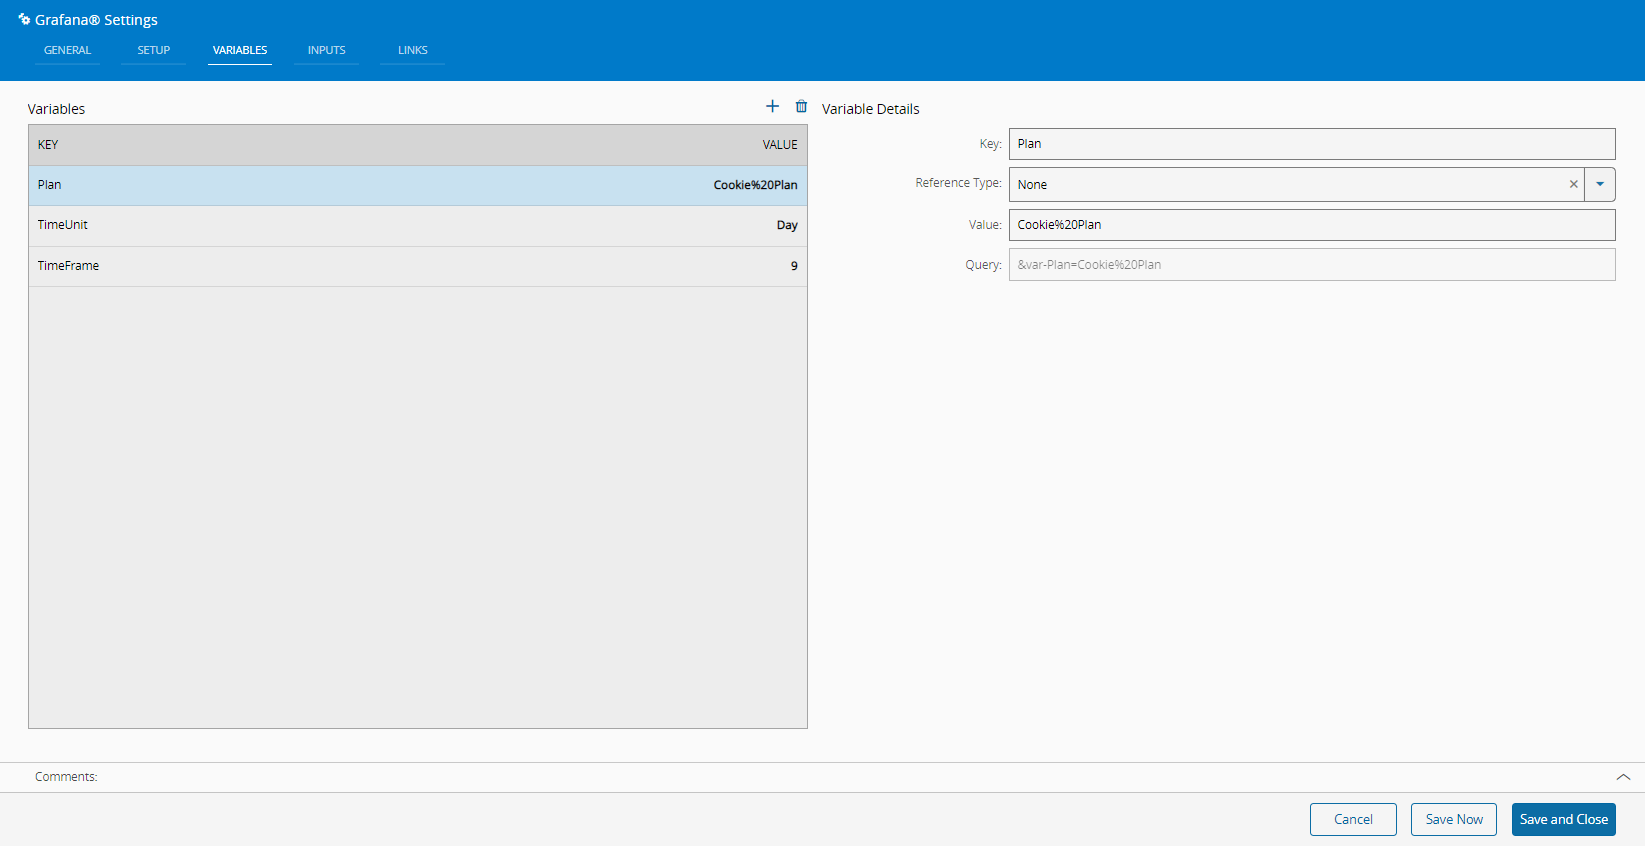
Note
The Variables you define in the settings are the default ones but you can introduce other settings from the UI Page into Grafana.
-
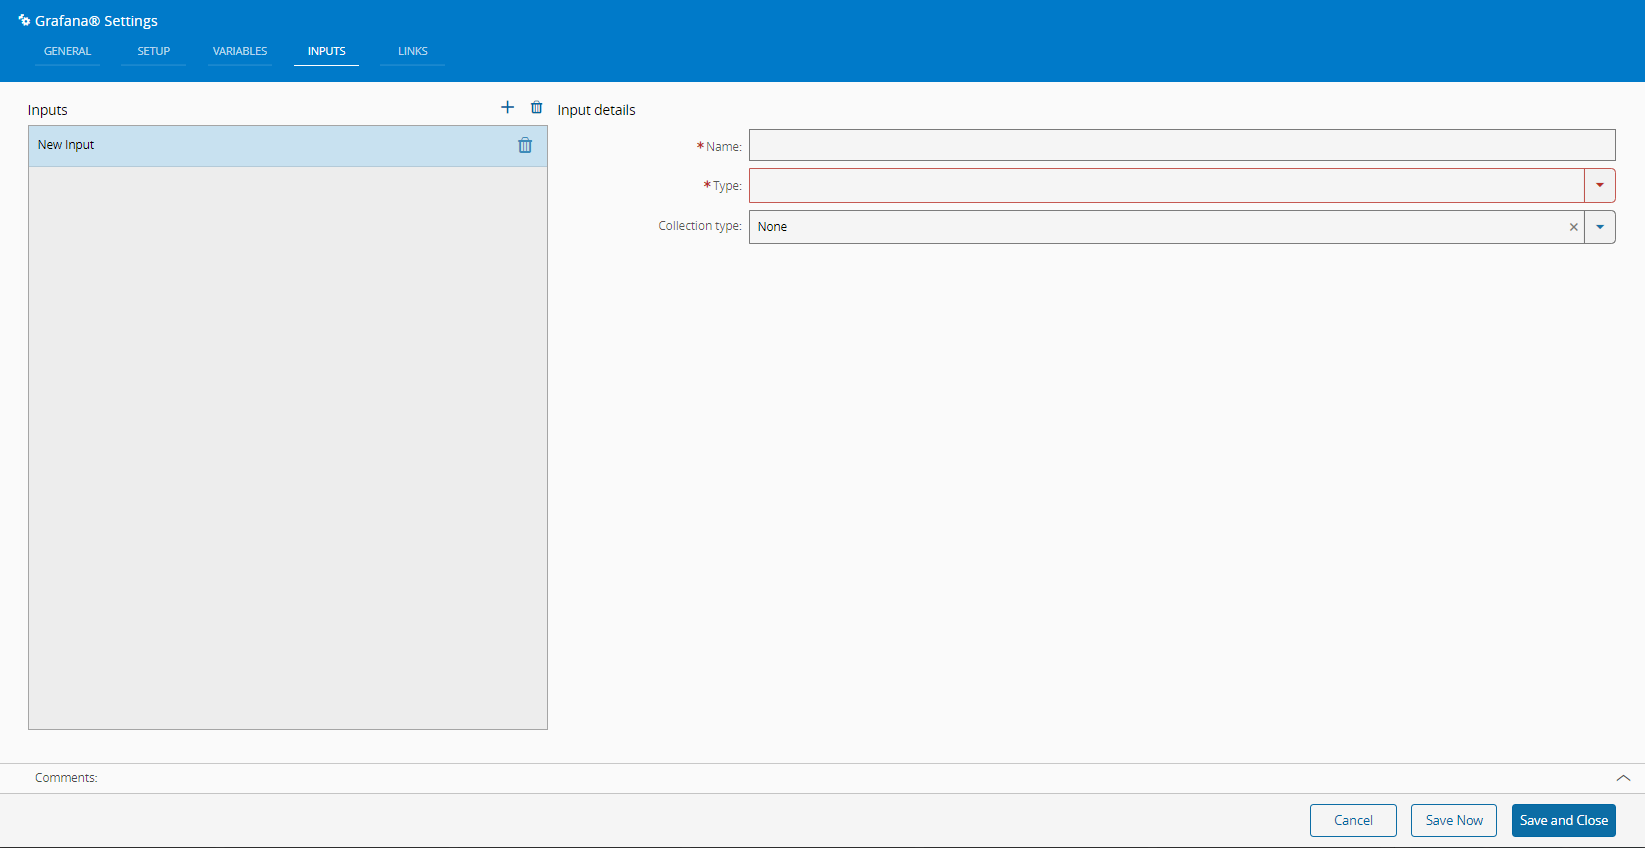
In the Inputs tab you can accordingly and notice that Name and Type are mandatory:
-
In the Links tab you can add links as needed and make your UI Page more dynamic.
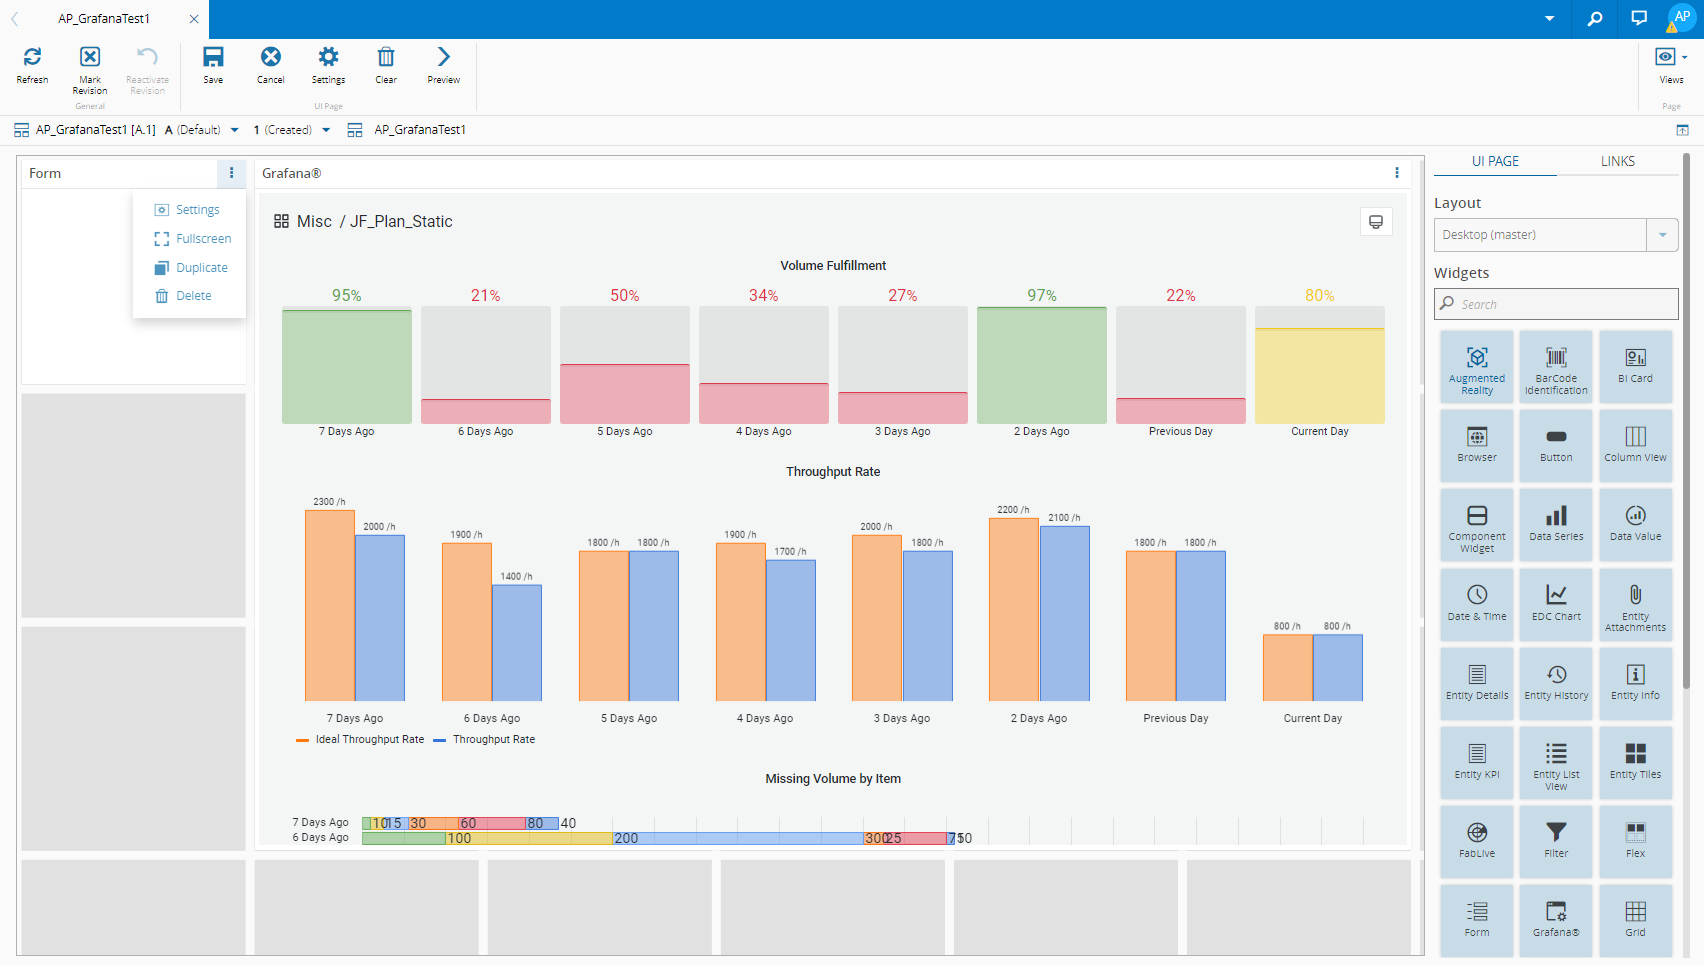
Example with Form widget:
a) Drag and drop the Form widget into your UI Page dashboard and select its Settings:
 b) Go to the Fields tab, select to change the TimeUnit variable, which is of the Type String, and Save and Close:
 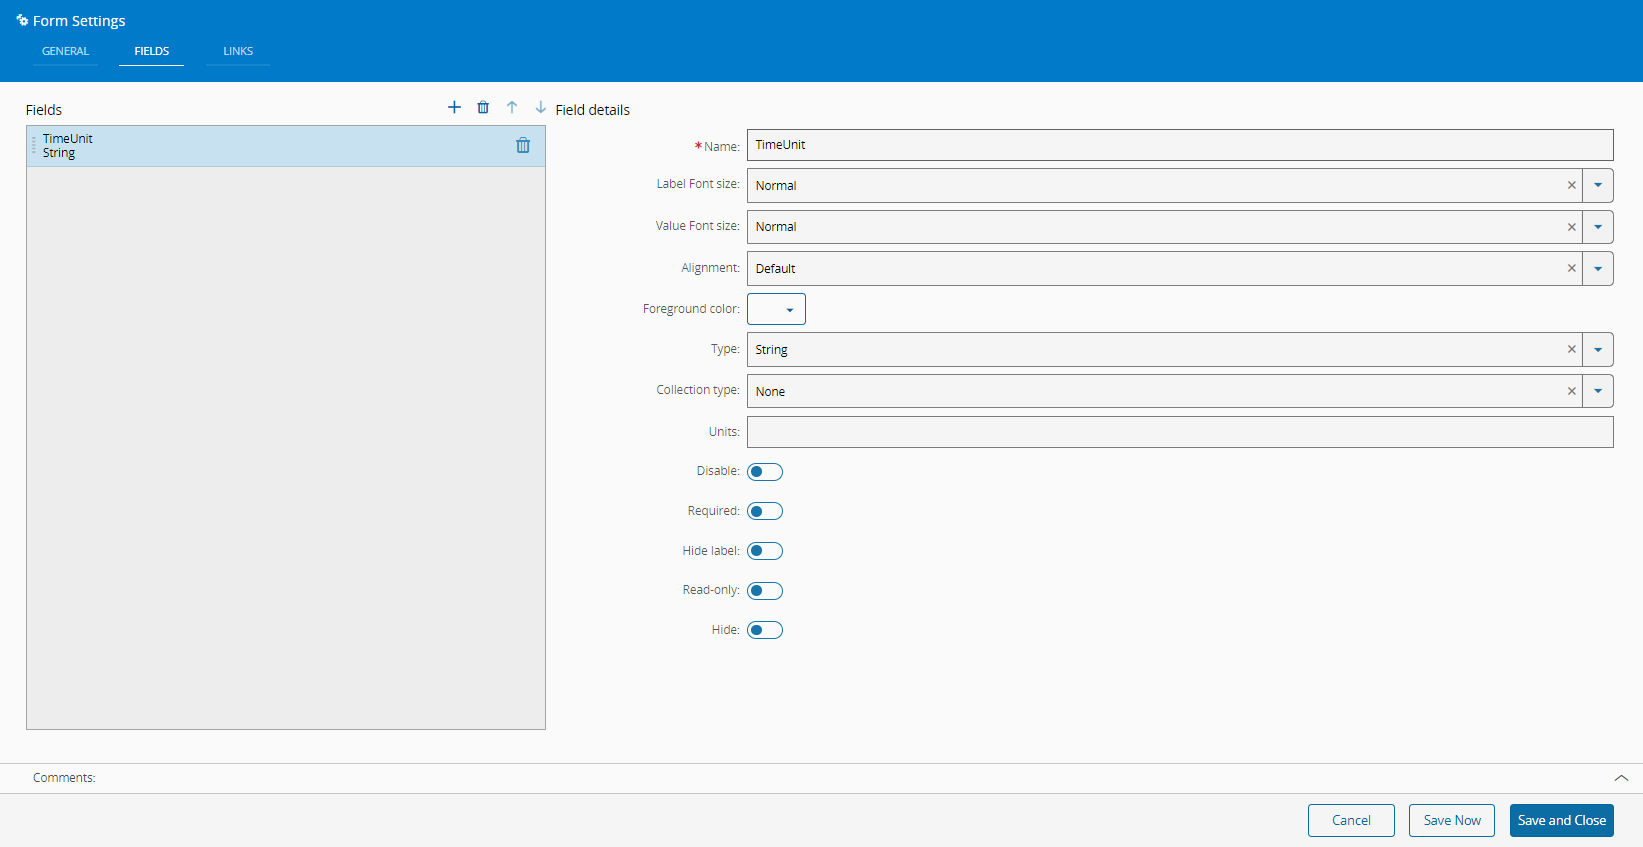 c) In your UI Page dashboard, define a value for the new TimeUnit:
 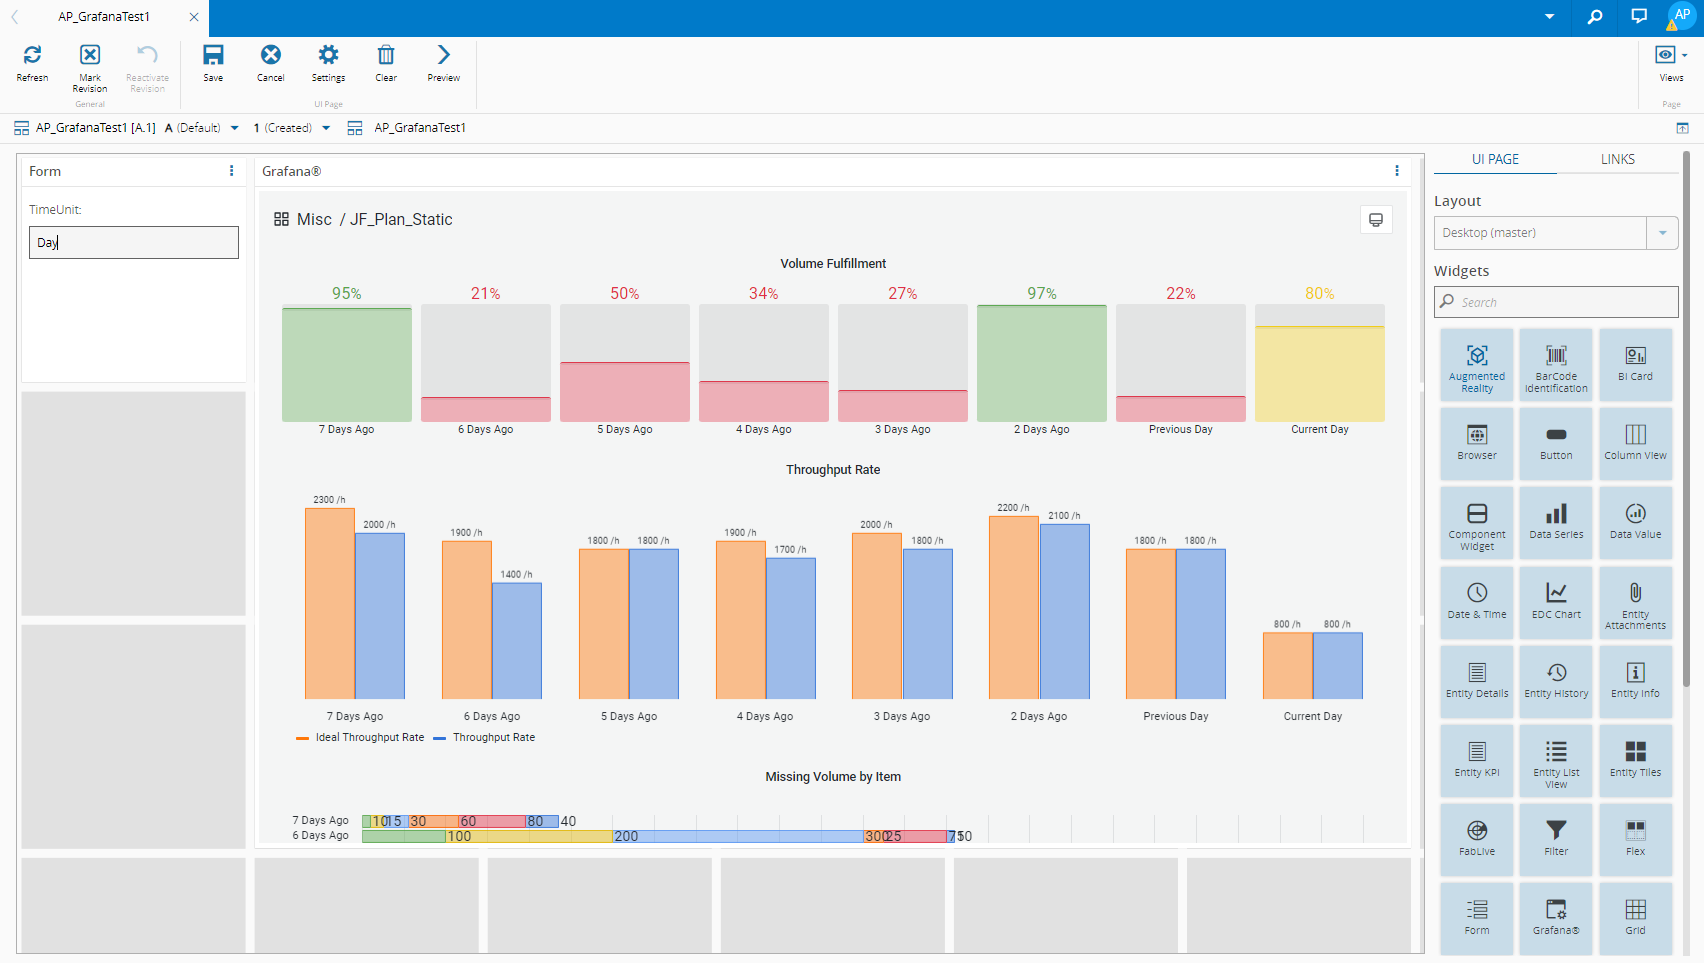 d) In the top ribbon select Settings, then in the Properties tab a new property that will be your TimeUnit label. Give it the appropriate Name, Source, Type, Value (key of the variable in Grafana), and Save and Close:
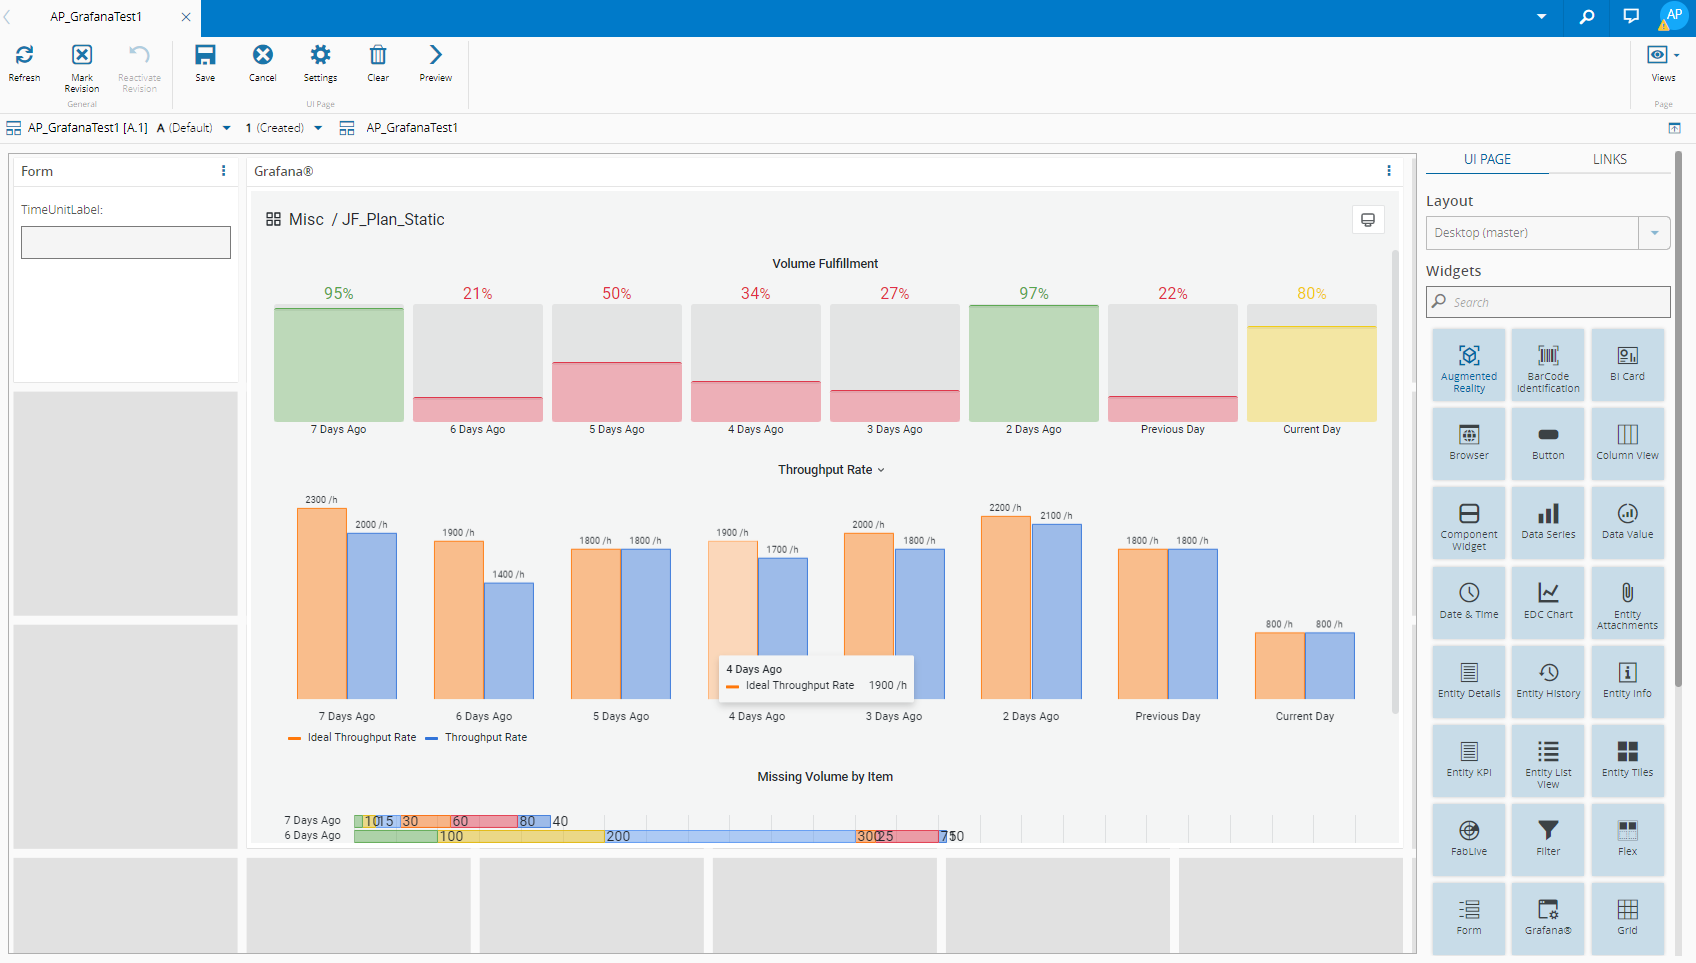
 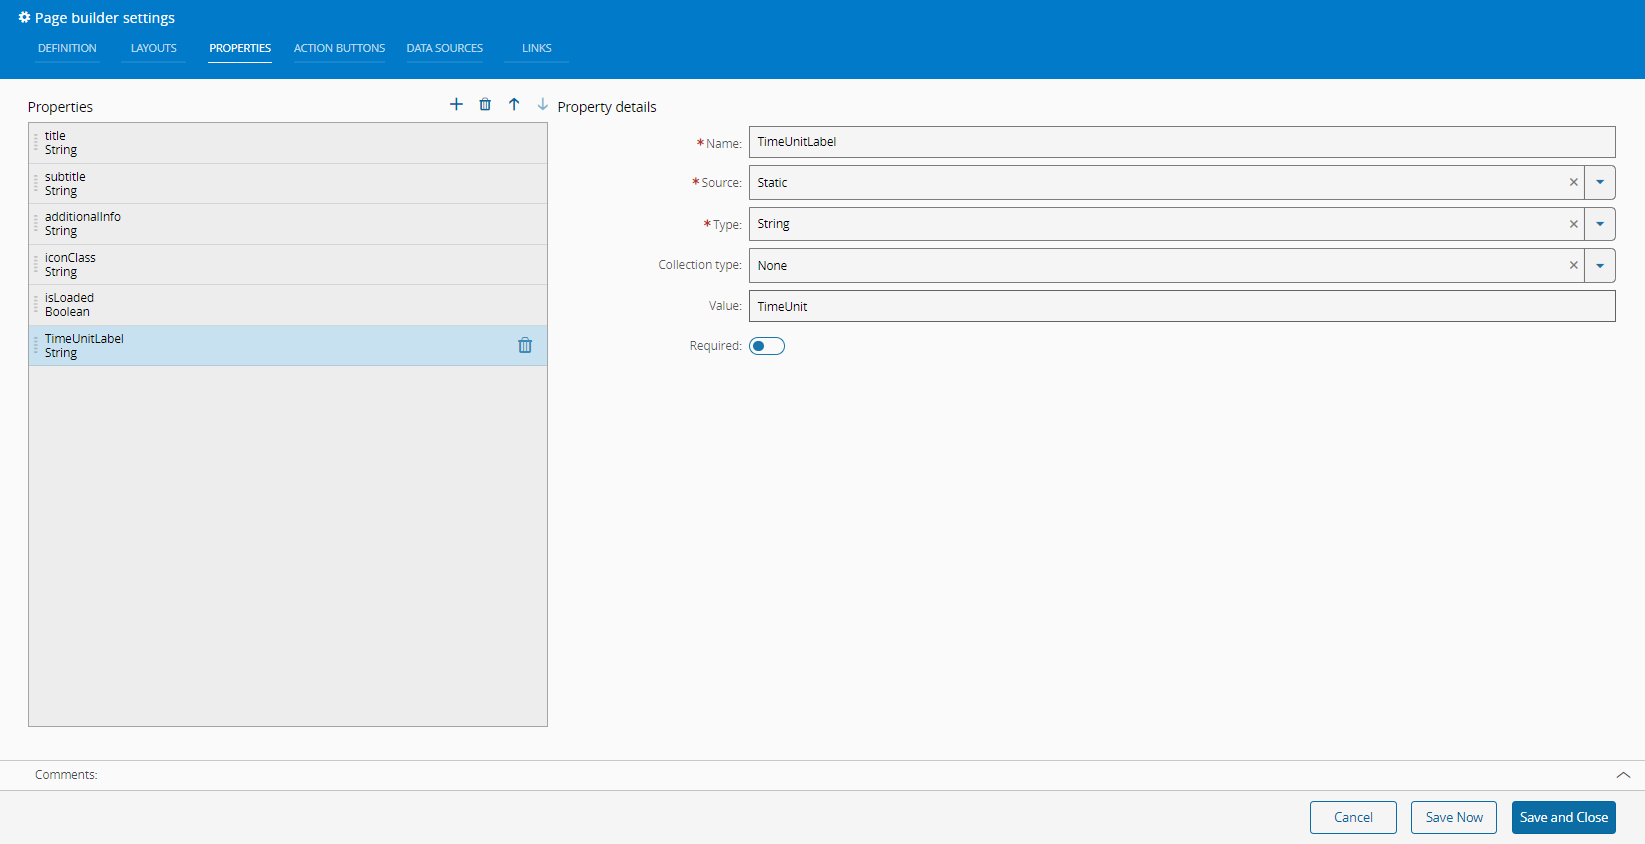 e) Select Links and drag and drop the Forms and Grafana widgets onto your page:
 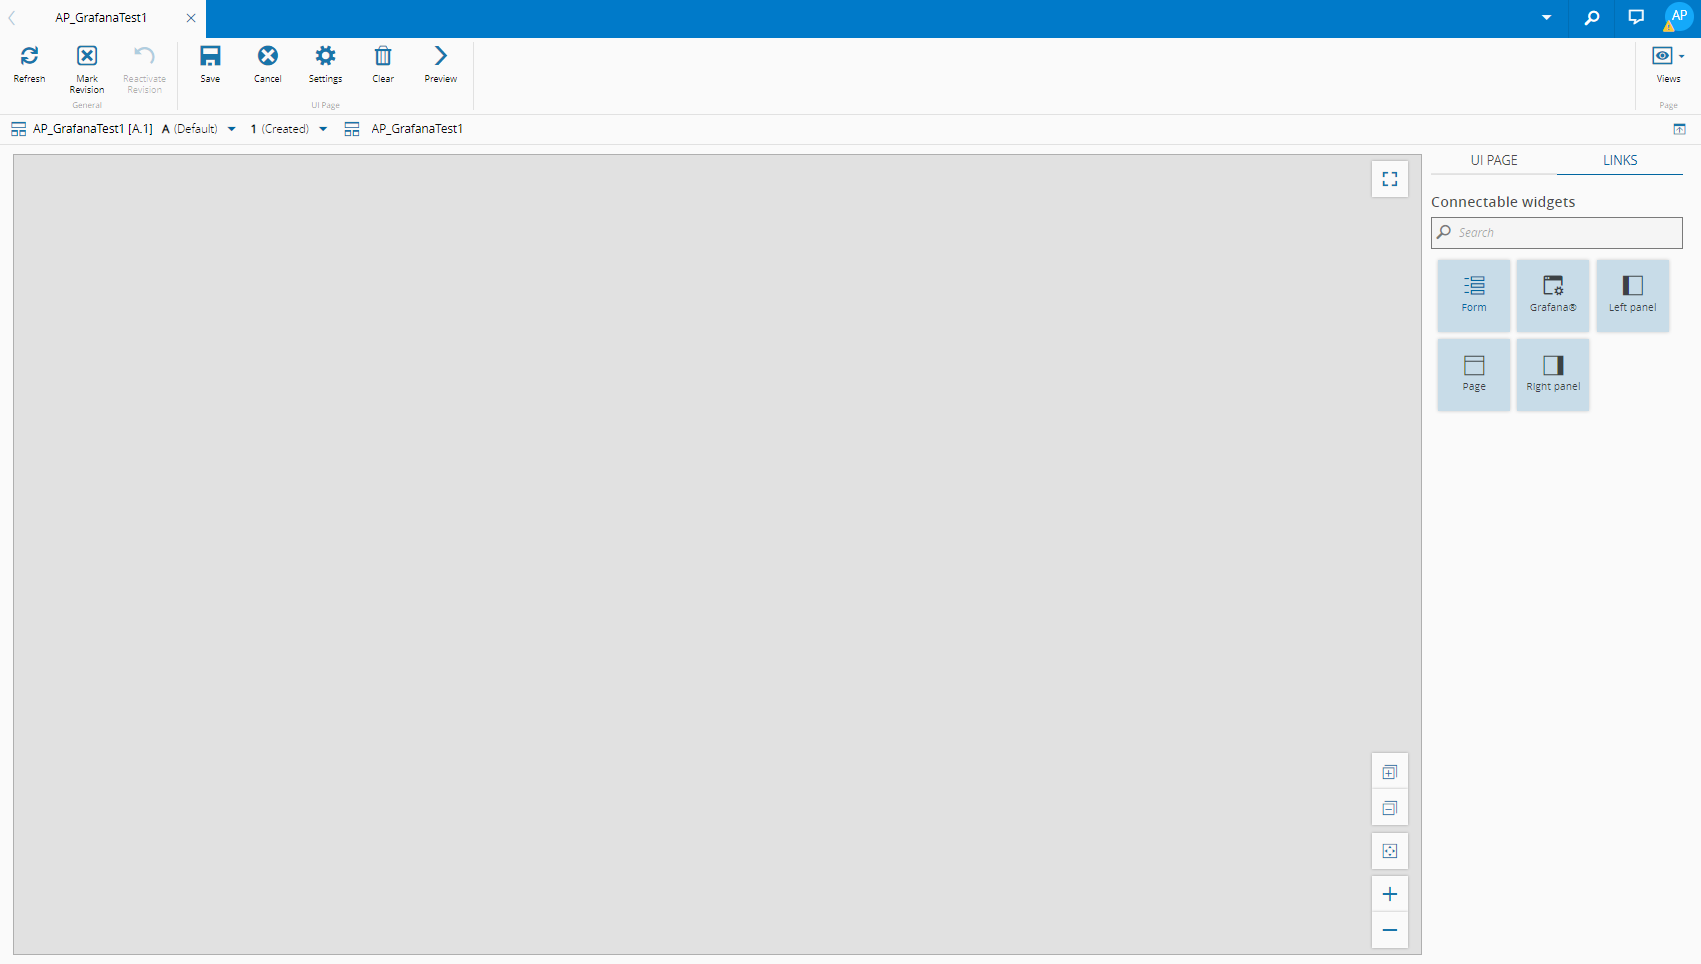 It will look like this:
 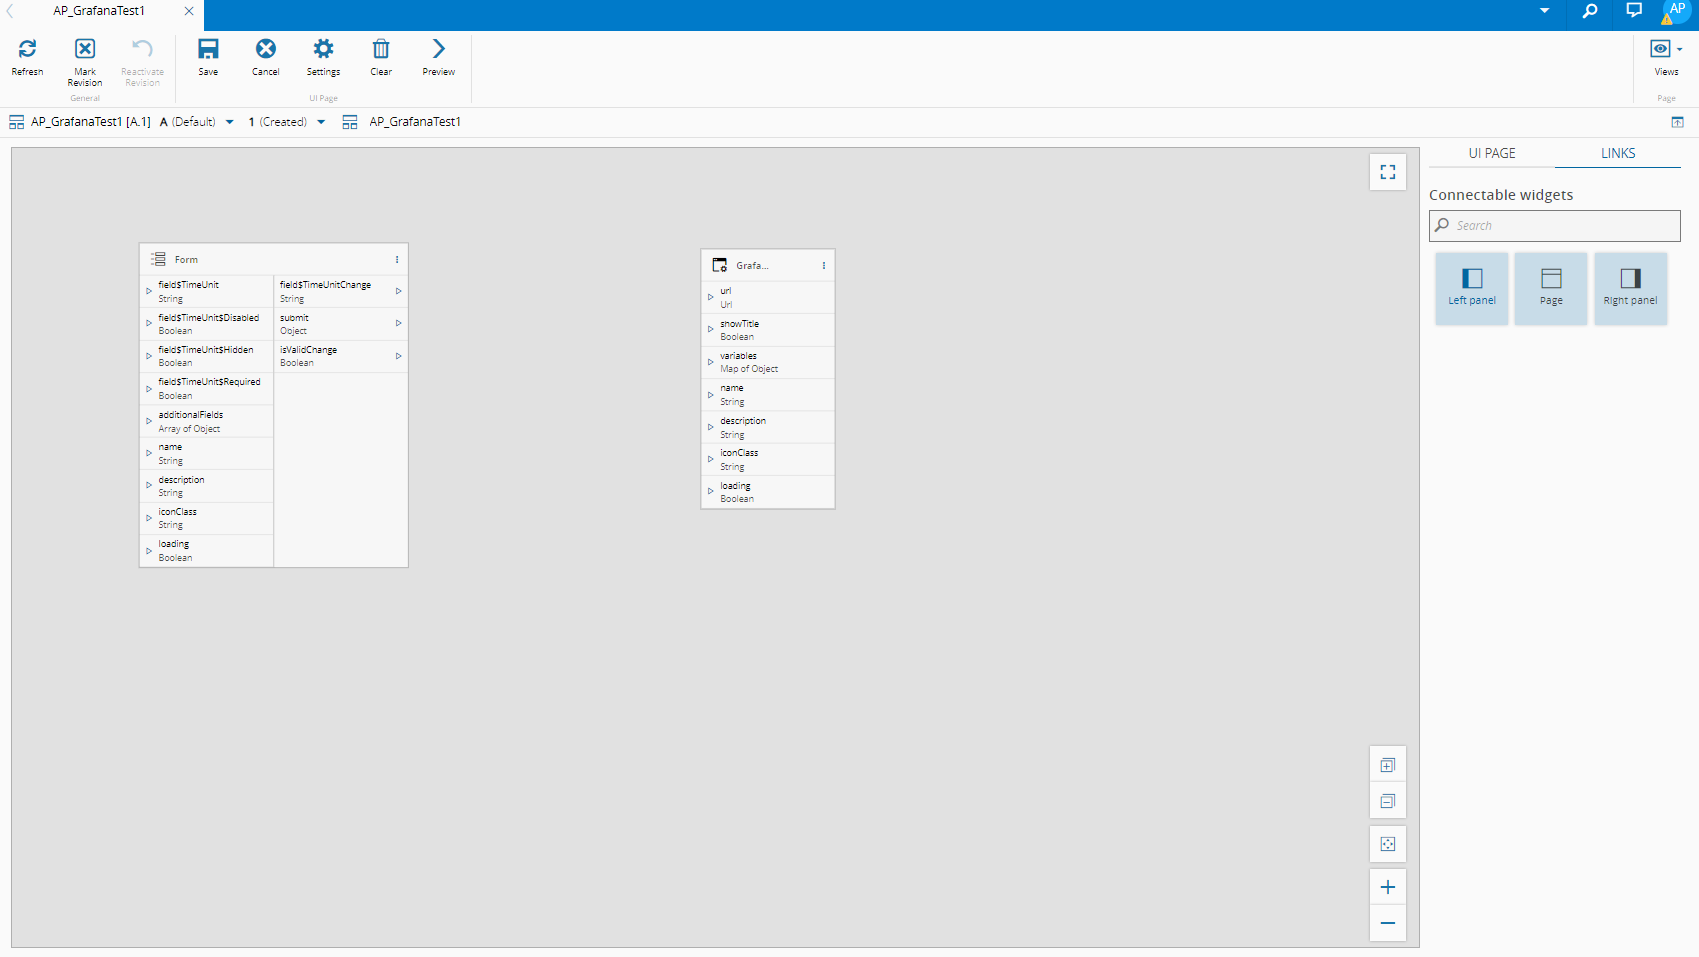 f) Send the result of the TimeUnitChange String to variables, which is a map, select
 setMapValuein Converter,TimeUnitLabel, created earlier, in Converter Param: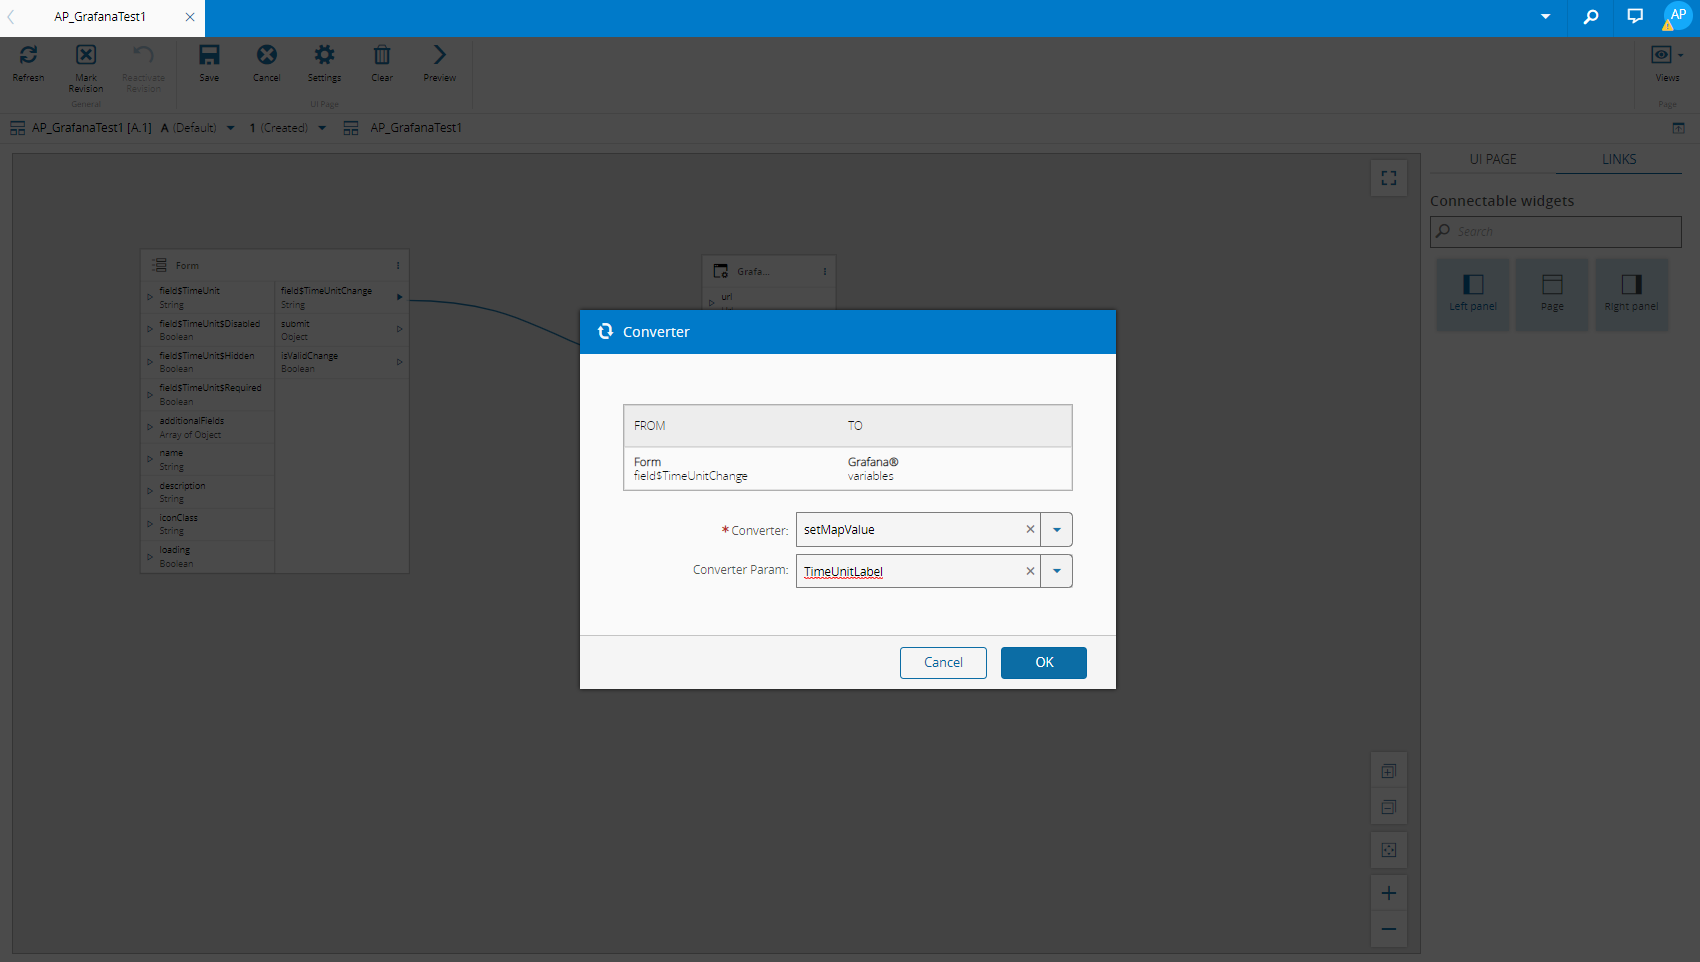 g) Select OK:
 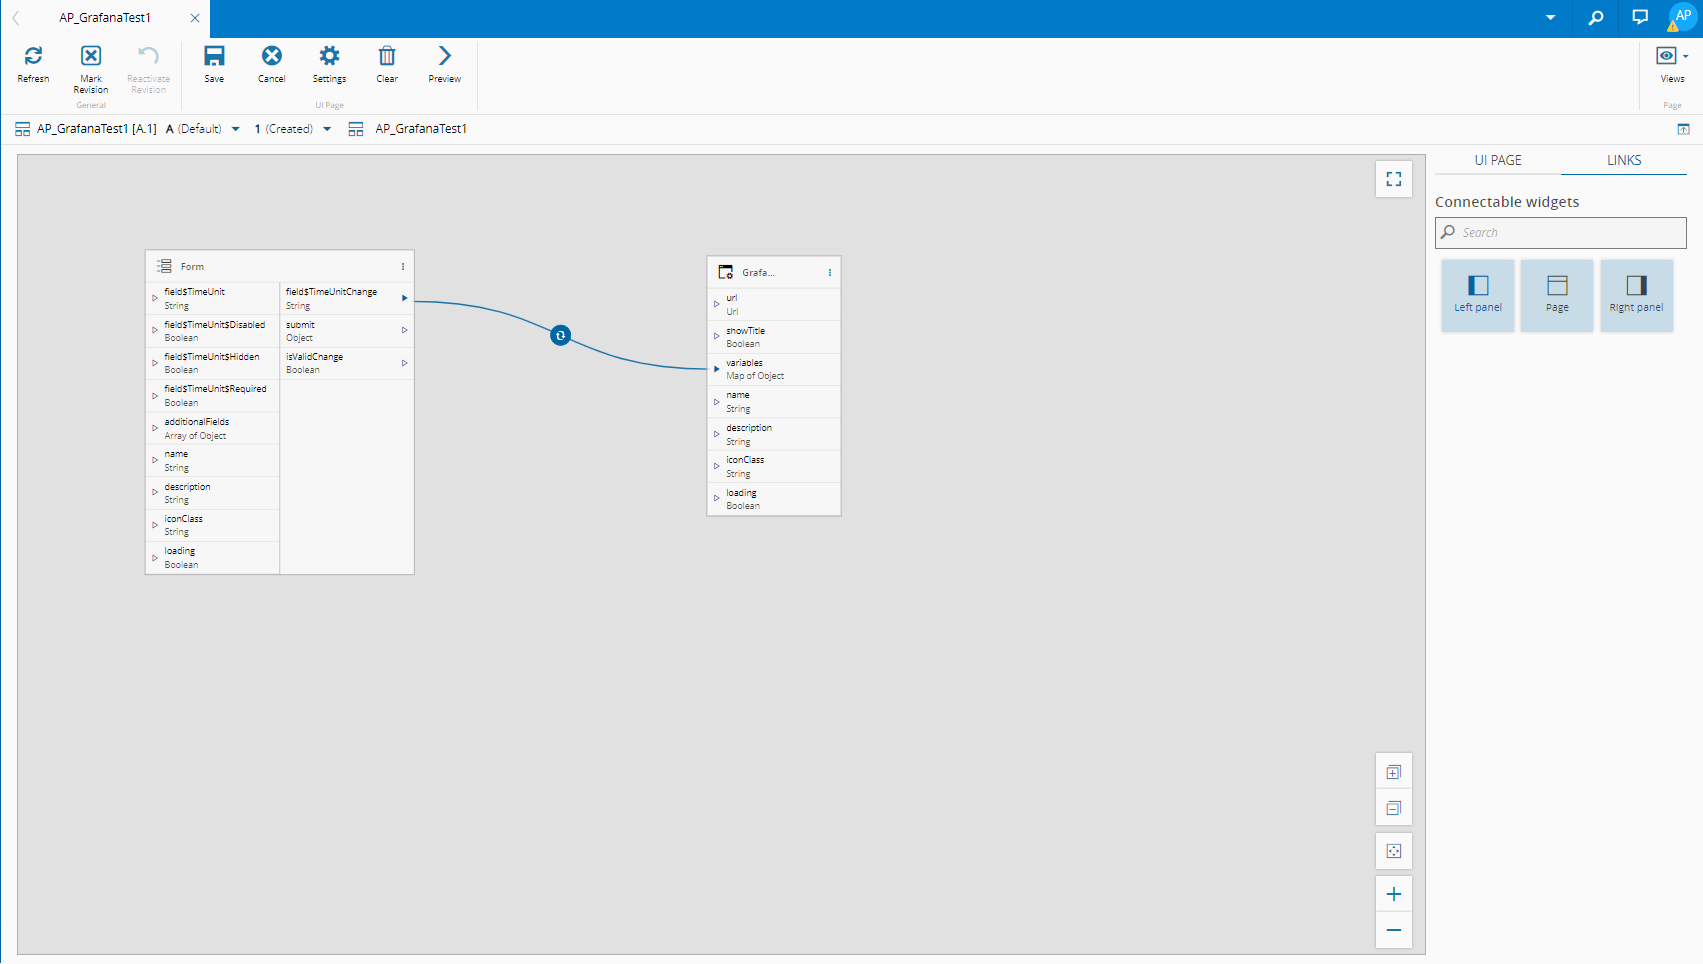 h) To check your link is correct, go to UI Page, select Settings and access the Links tab:
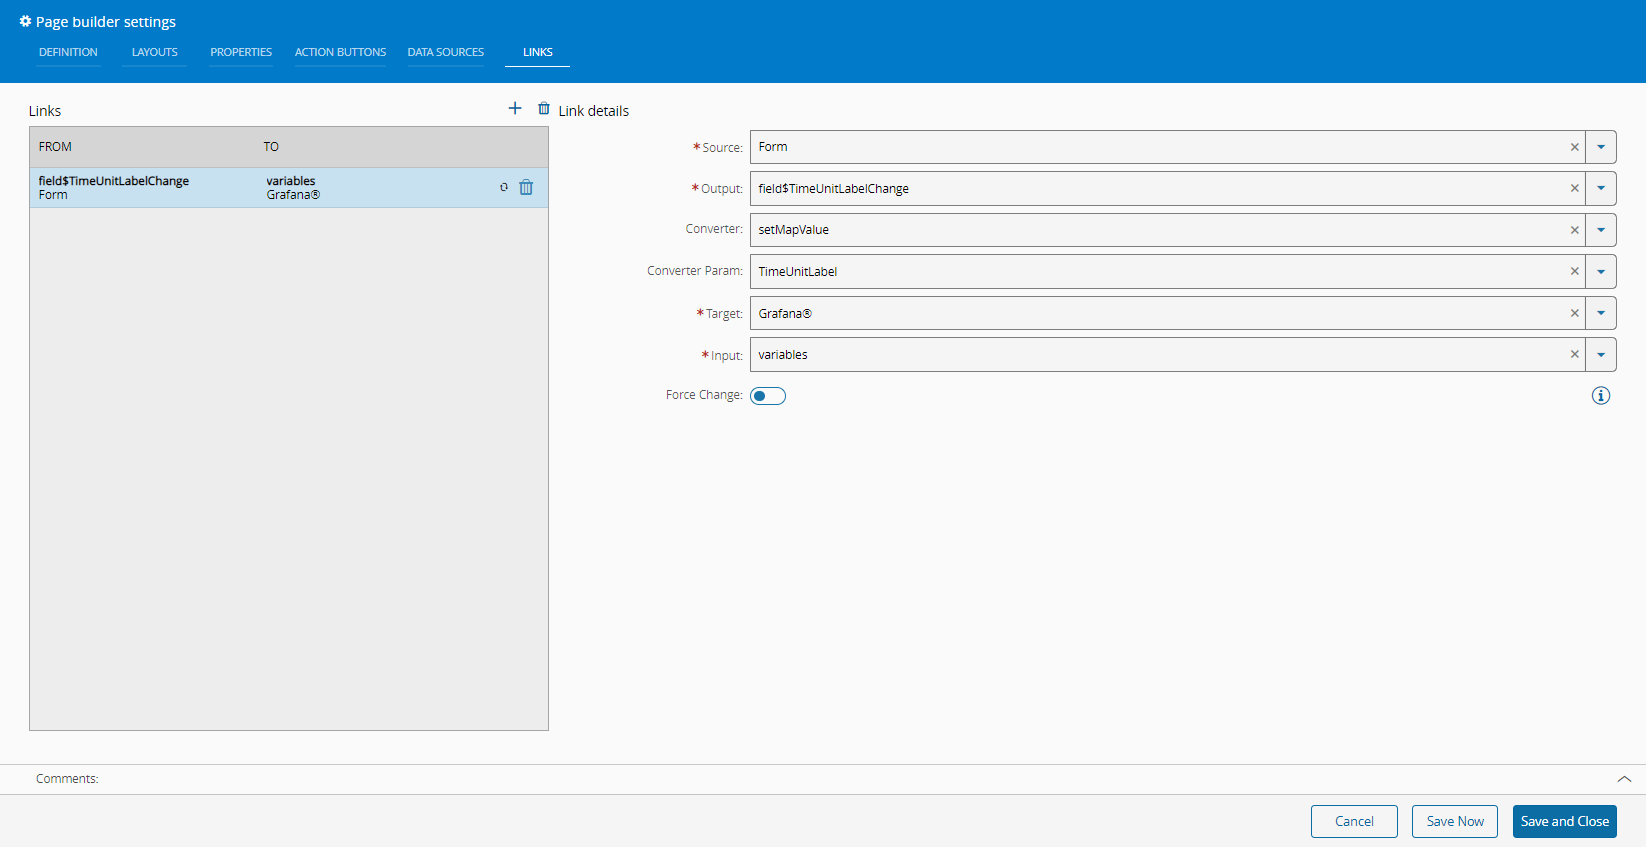
-
By saving and closing the settings, the widget will be changed accordingly:
Info
For more information, see the Grafana tutorial.