SPC Widget#
![]()
Overview#
The SPC Widget places a Chart in a UIPage by visually representing the Logical Charts associated to it along with information regarding the collected data and aggregations performed on it.
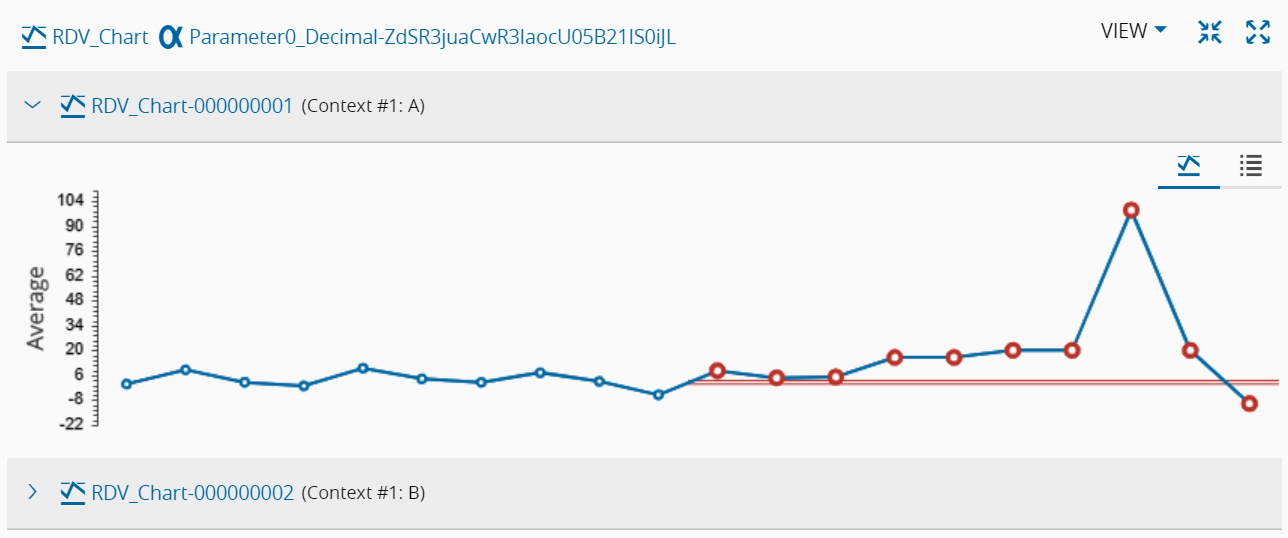
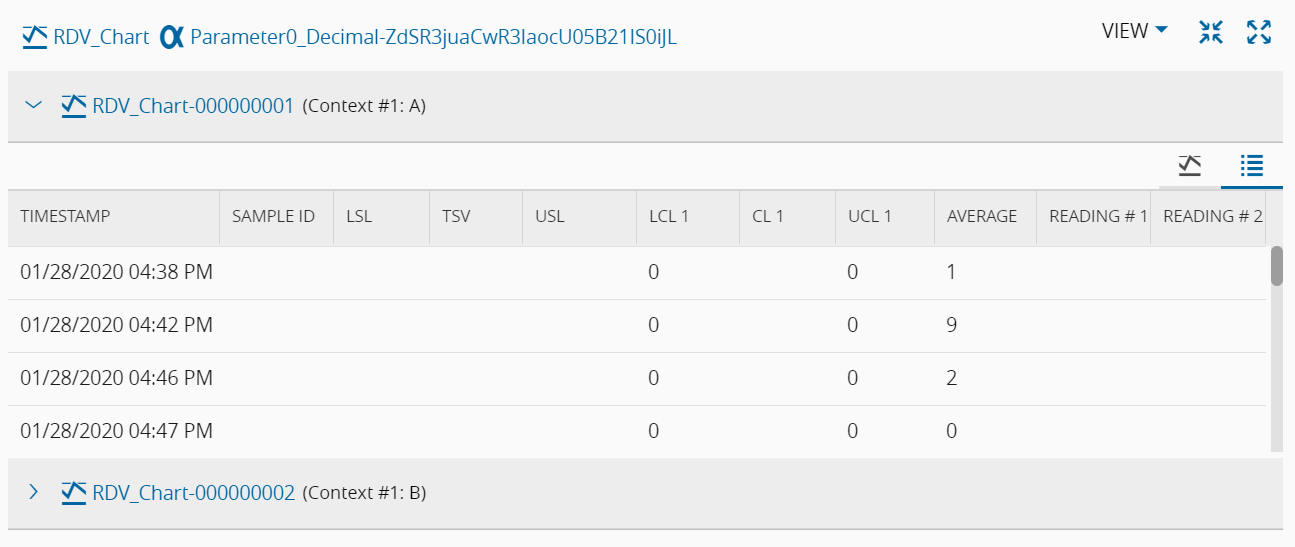
The user can choose to see the graphic visualization of the data or a table with the data itself:
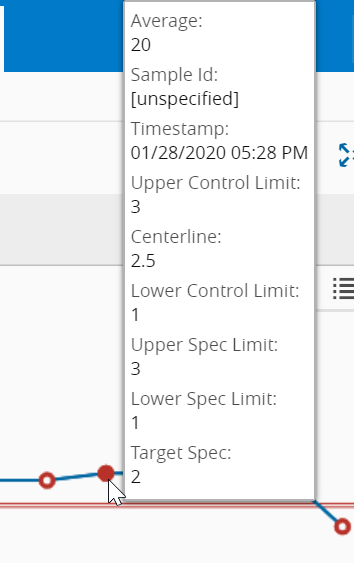
While in the graph visualization mode, hovering over the data points displays extra information on them:
To use the SPC Widget in an UIPage, follow the steps below:
- In any UIPage in Build mode, select the SPC Widget from the Widgets list located in the right side of the page, and drag and drop to the correct place in the UIPage.
- Enter the Settings section of the Widget.
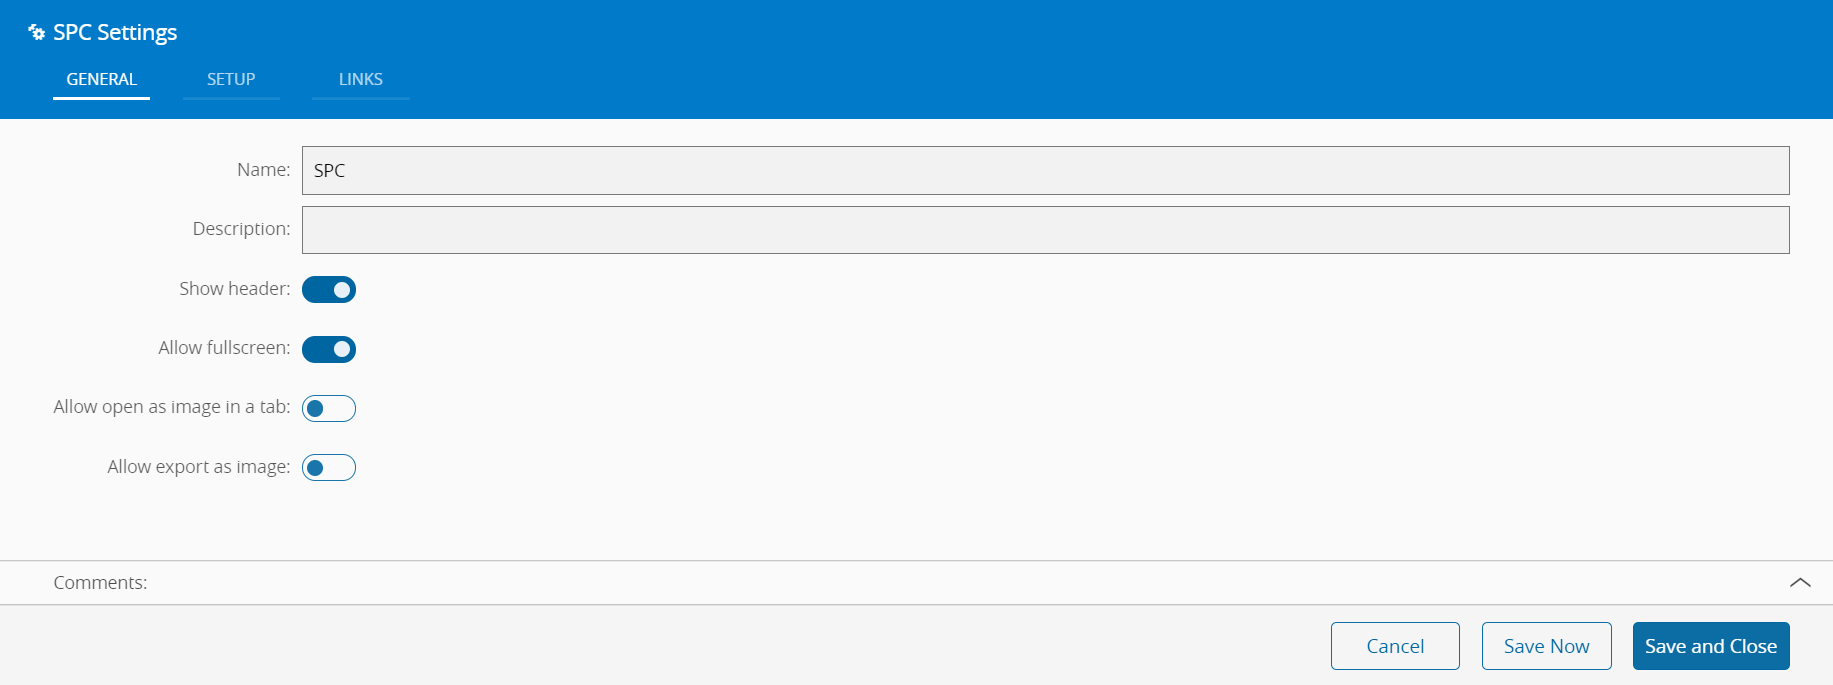
-
In the General tab, provide a name for the Widget, a description, and whether it should display the header and also if the user can activate the full screen mode. The user can also decide if the widget can be exported as an image.
-
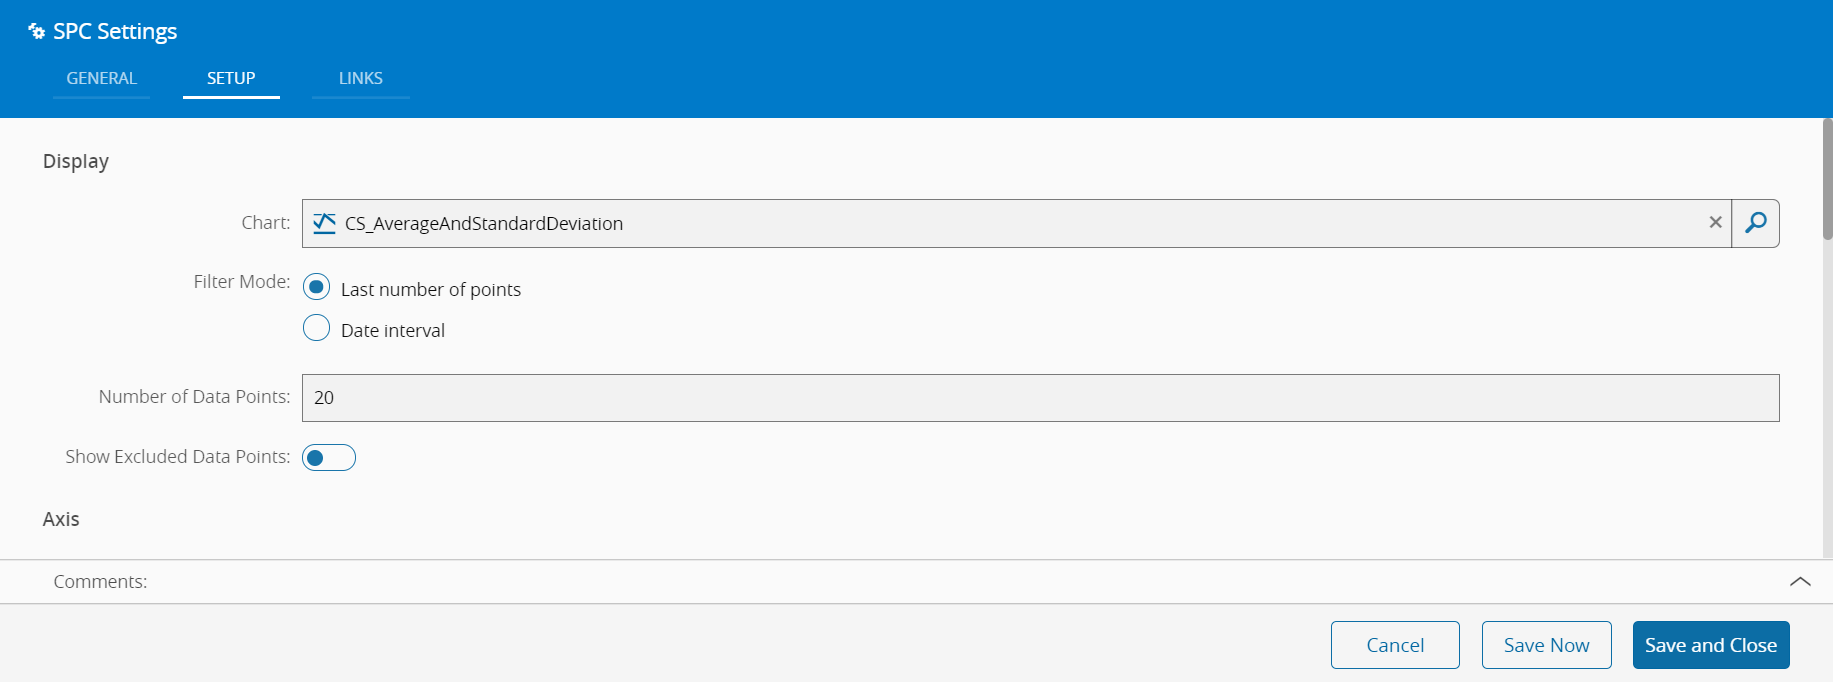
In the Setup tab, the widget can be configured through the following fields:
- Display
- Chart object from which to retrieve the data
- Show Date/Time labels for the data points
- Filter mode:
- Last number of points (if selected, define the number of points to be visible)
- Date interval. If selected, also define:
- From date
- To date
- Show excluded data points, if desired
- Axis
- Y-Axis Scale
- Automatic
- Manual - so that it remains fixed when being viewed. If selected, define the Y-Axis units as well as minimum and maximum values for the Y-Axis
- Show Timestamp
- Limits
- Show Control Limits
- Show Spec Limits
- Show Target Value
- Statistics: select one or more of the following available statistics:
- Count
- Cp
- Cpk
- Max
- Mean
- Median
- Min
- OOS
- OOC (%)
- Ppk
- Range
- Standard Deviation
- LCLCR
- CLCR
- UCLCR
- OTI
- OCI
- Filters - the user can define the context that should be used as a filter for the data to be displayed. Available filters are:
- Facility
- Area
- Step
- Resource
- Product
- Flow
-
Optionally, define the links between this Widget and other elements of the UIPage in the Links tab.
- By saving and closing the settings, the widget will be changed accordingly.