Grafana#

Overview#
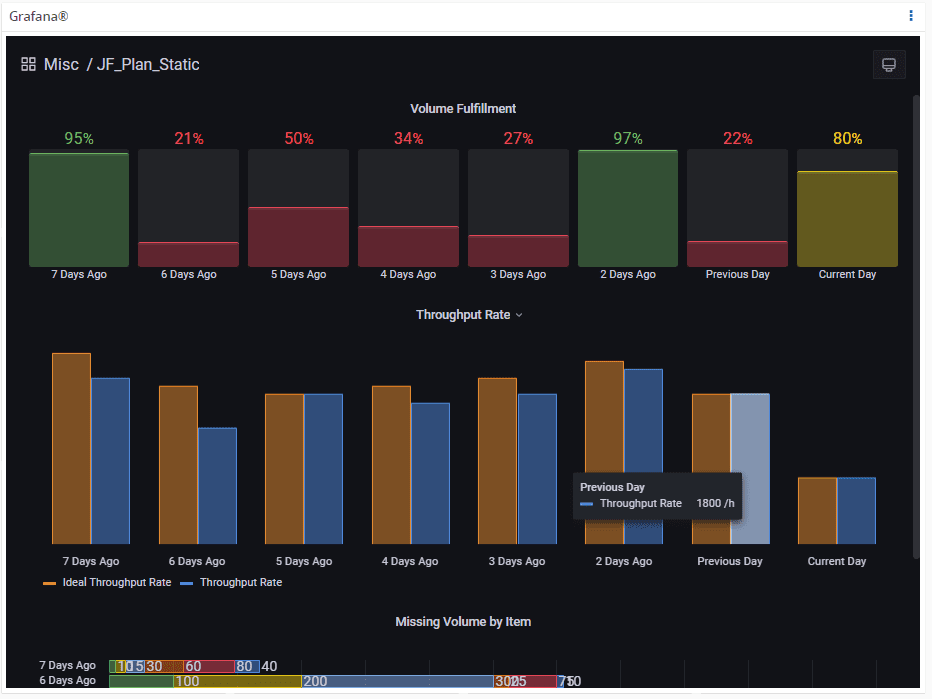
The Grafana widget is used within Critical Manufacturing MES but your original Grafana dashboard is initially created in a separate external page.
Warning
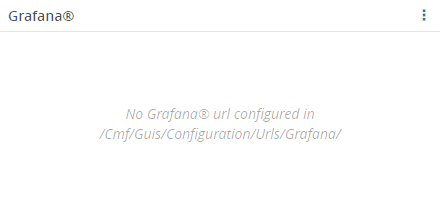
Given that Grafana is a server that can be deployed within the realm of the current customer environment (in a separate container sharing the same network and environment stack) or in an autonomous installation to be used by multiple environments, a configuration key is required to indicate the proper URL to be used for this specific environment. That key is /Cmf/Guis/Configuration/Urls/Grafana/ and should hold the value for the current Grafana server location (example: https://grafanaserver.companydomain.com:443/grafana). If the configuration entry is not filled in, the widget will display an error:
General Steps#
To use the Grafana widget in a UI Page, follow the steps below:
-
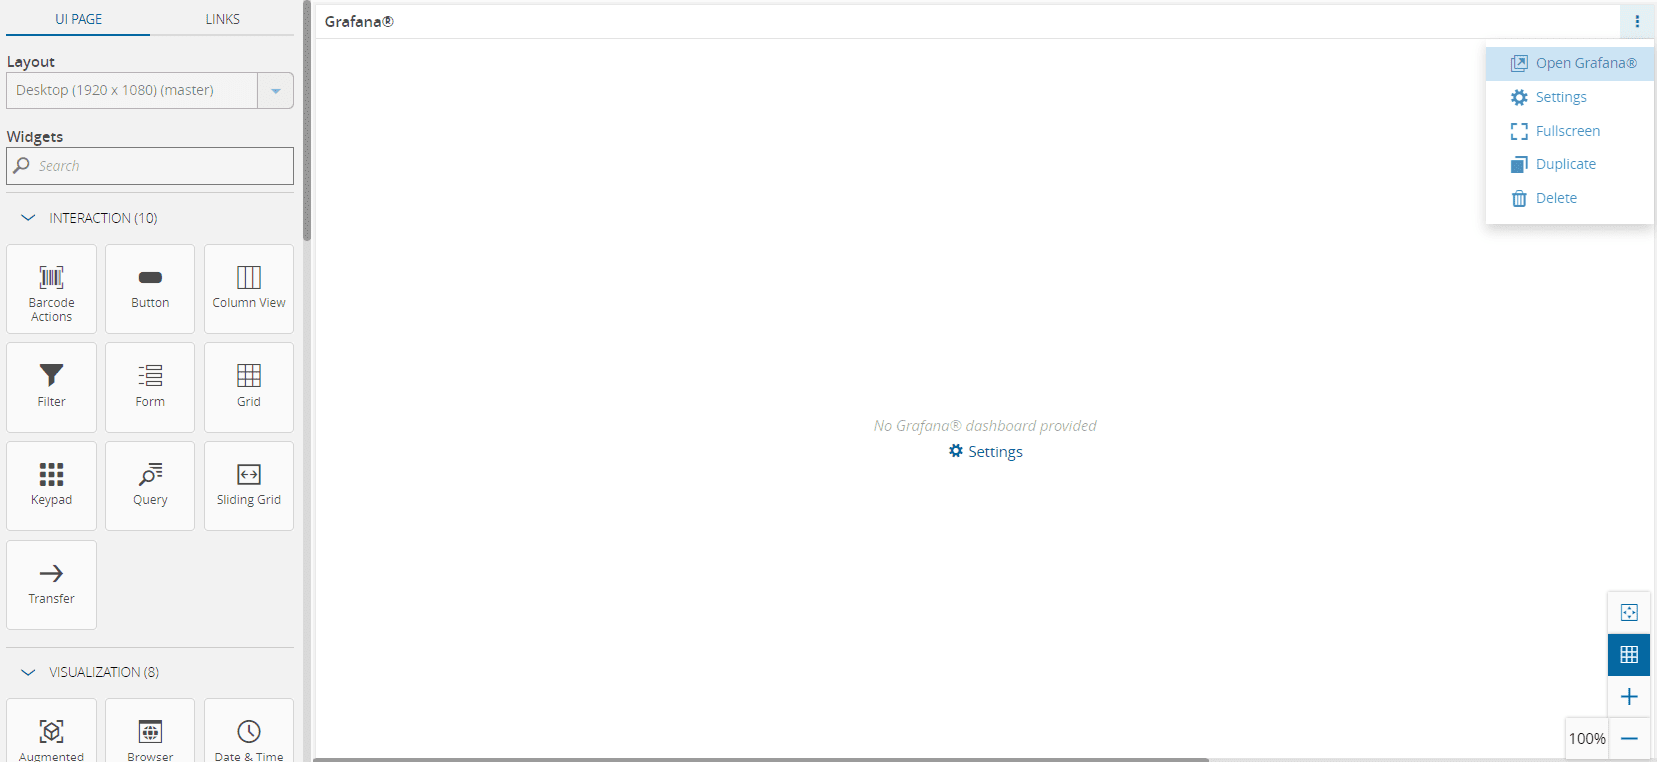
Drag and drop the Grafana widget into the desired place, expand it as needed, and then select Open Grafana:
-
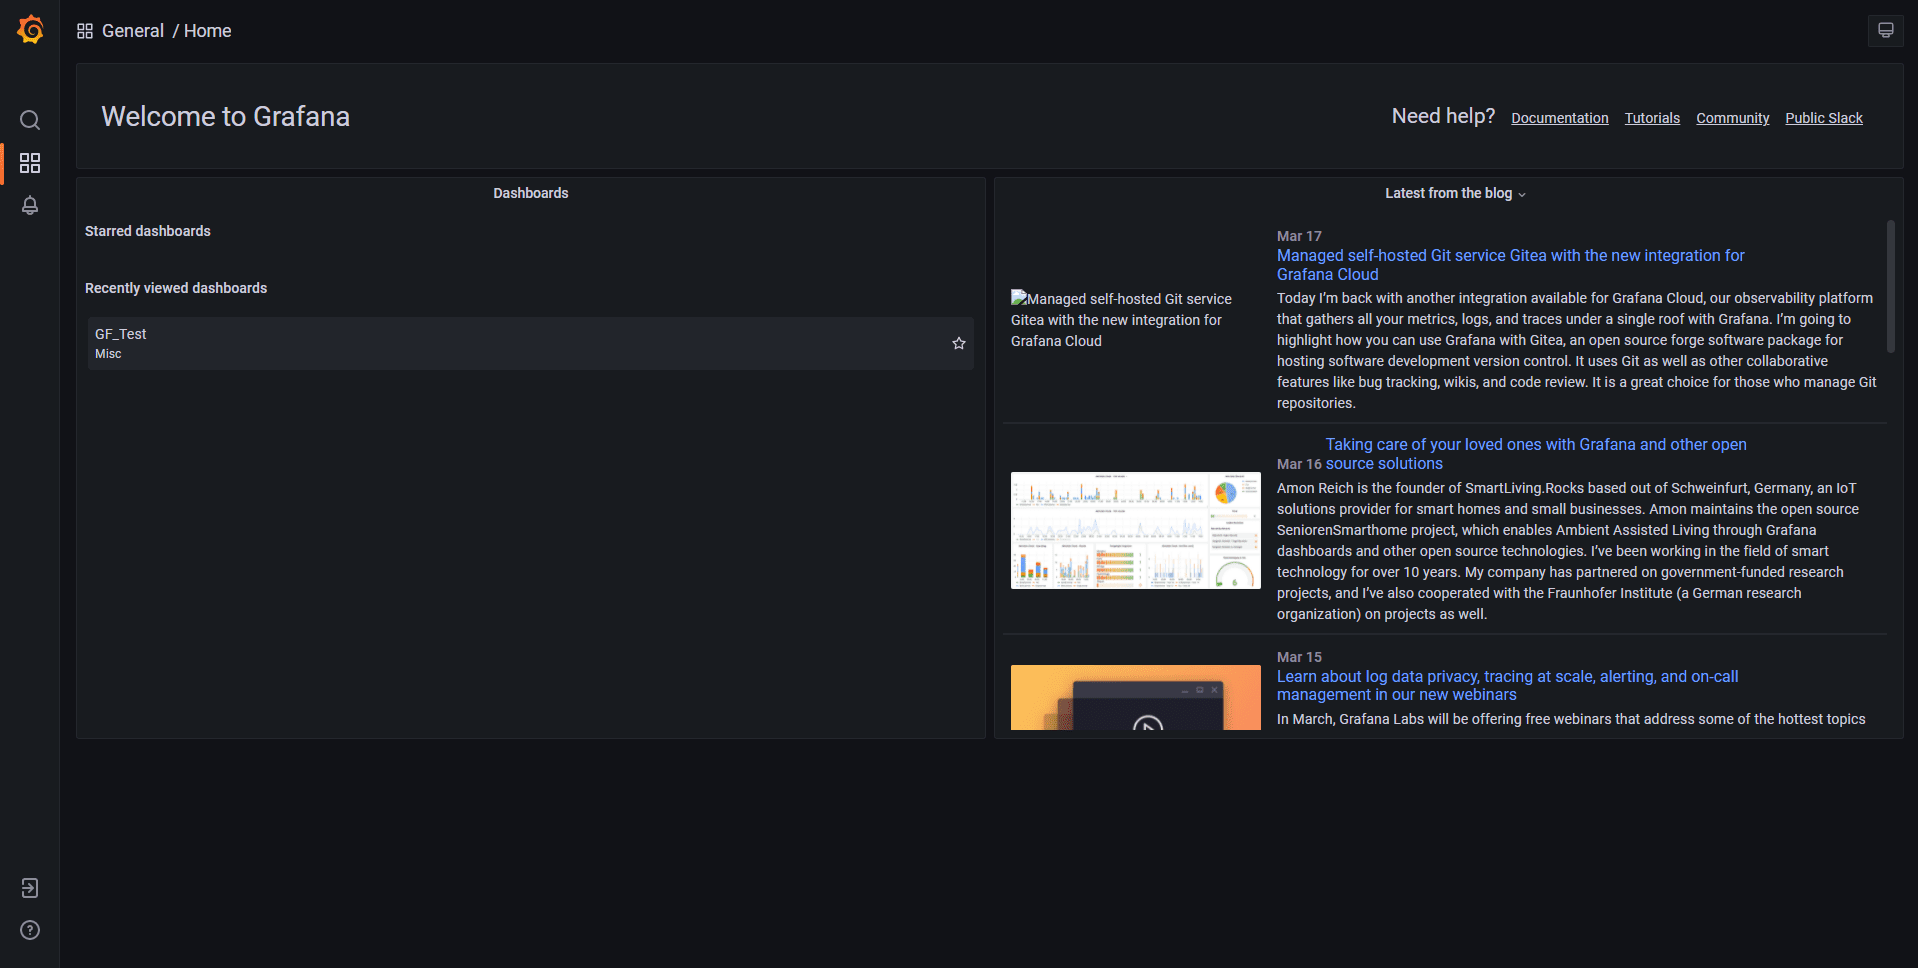
The Grafana entry page looks like this:
Note
This page is very important because in the Need help? section you can access Documentation ⧉ and other useful links to help you start creating your Grafana dashboard.
-
Create your dashboard in Grafana and copy its address.
-
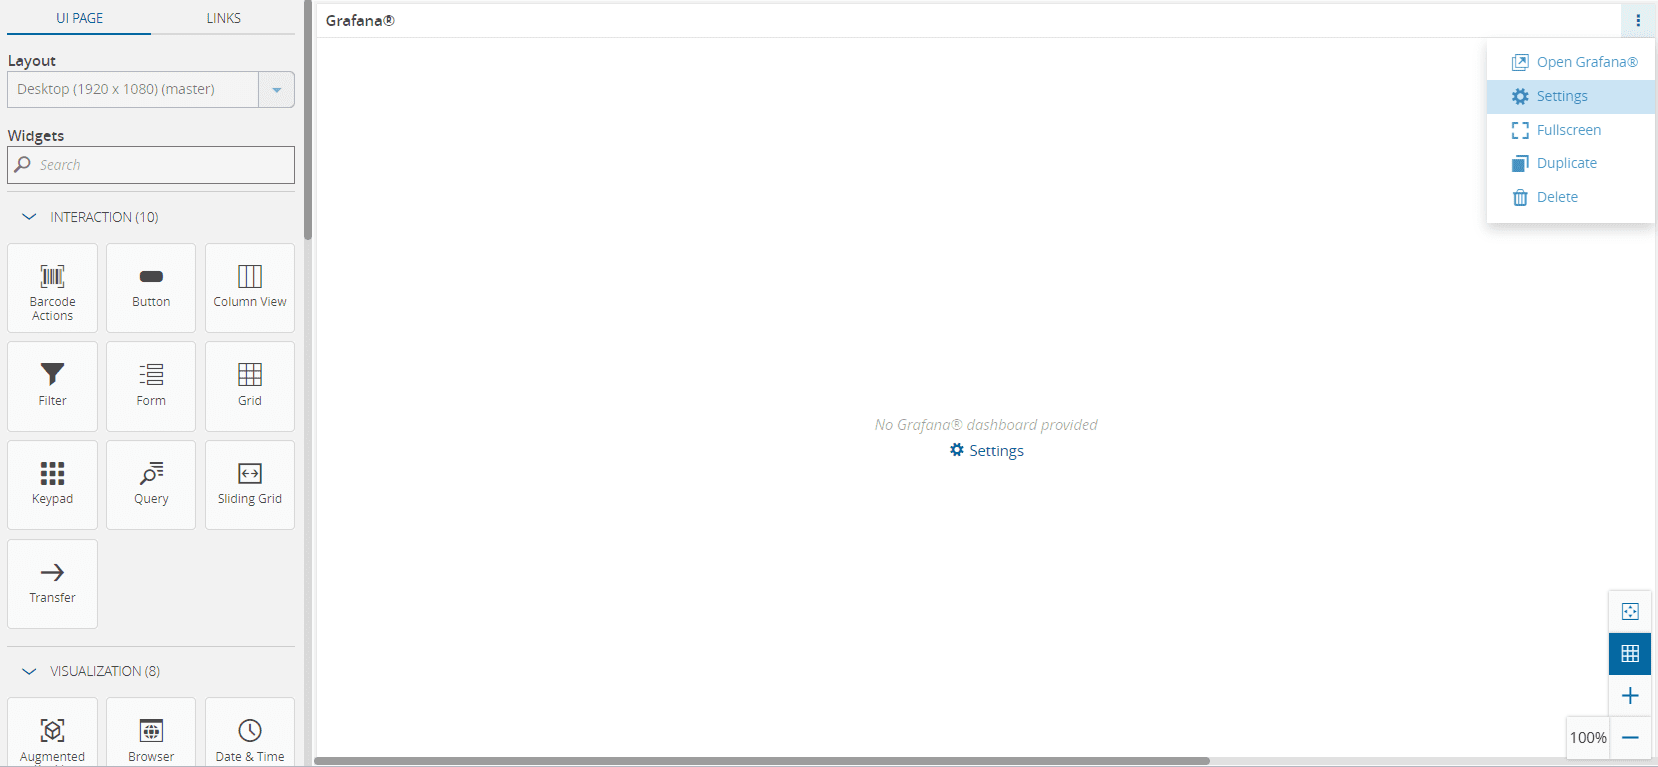
In the created UI Page, select Settings either in the More dropdown or on the center page of the Grafana widget:
-
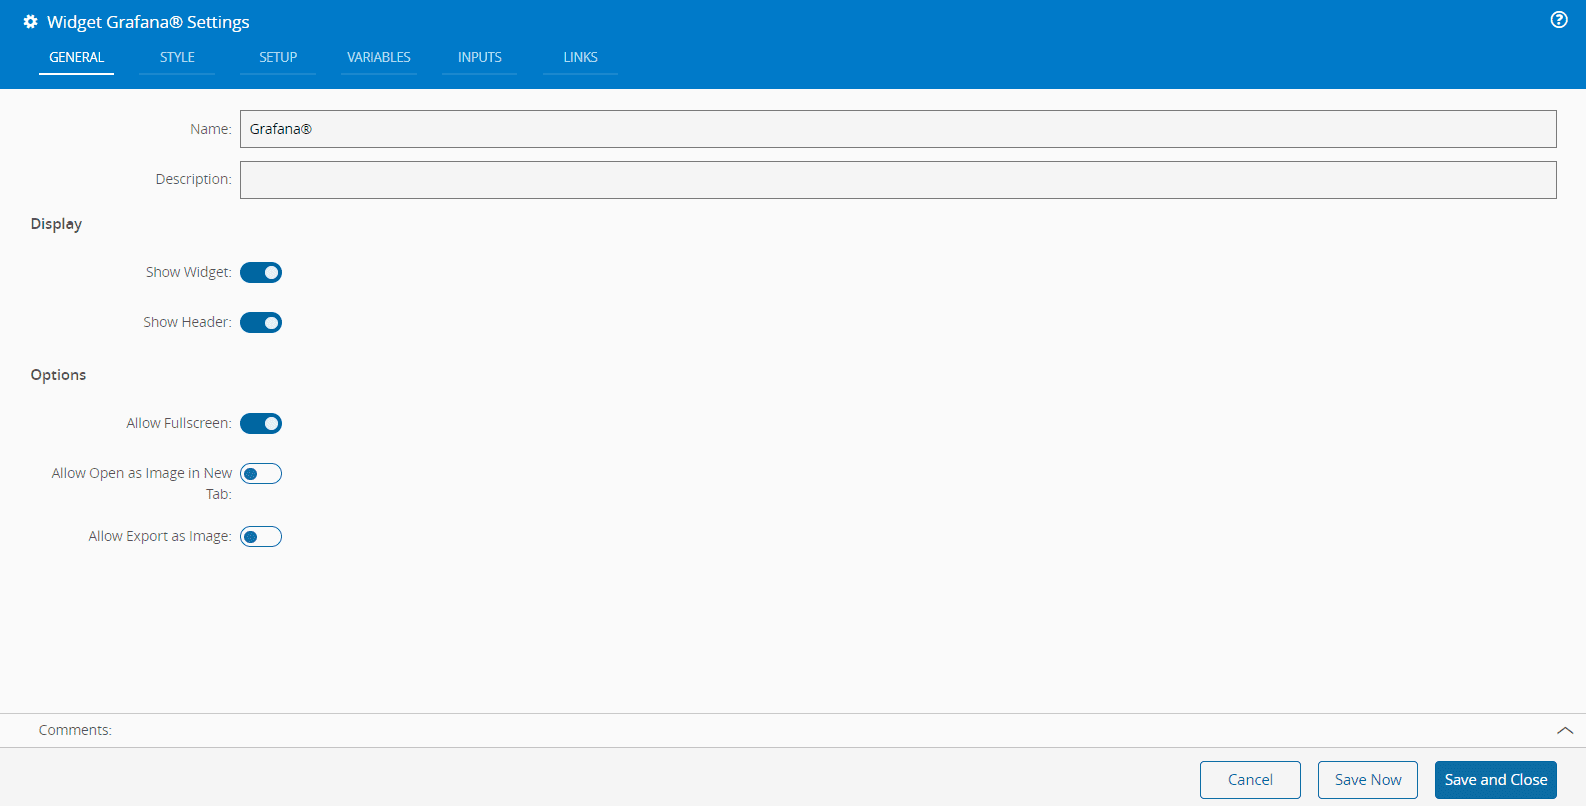
In the General tab, provide a name (Grafana by default) and a description for the widget. Use the toggle buttons to specify whether the widget should be visible, display the header, or allow full screen mode. Additionally, determine if the widget can be opened as an image in a new tab or exported as an image.
Widget Customization#
-
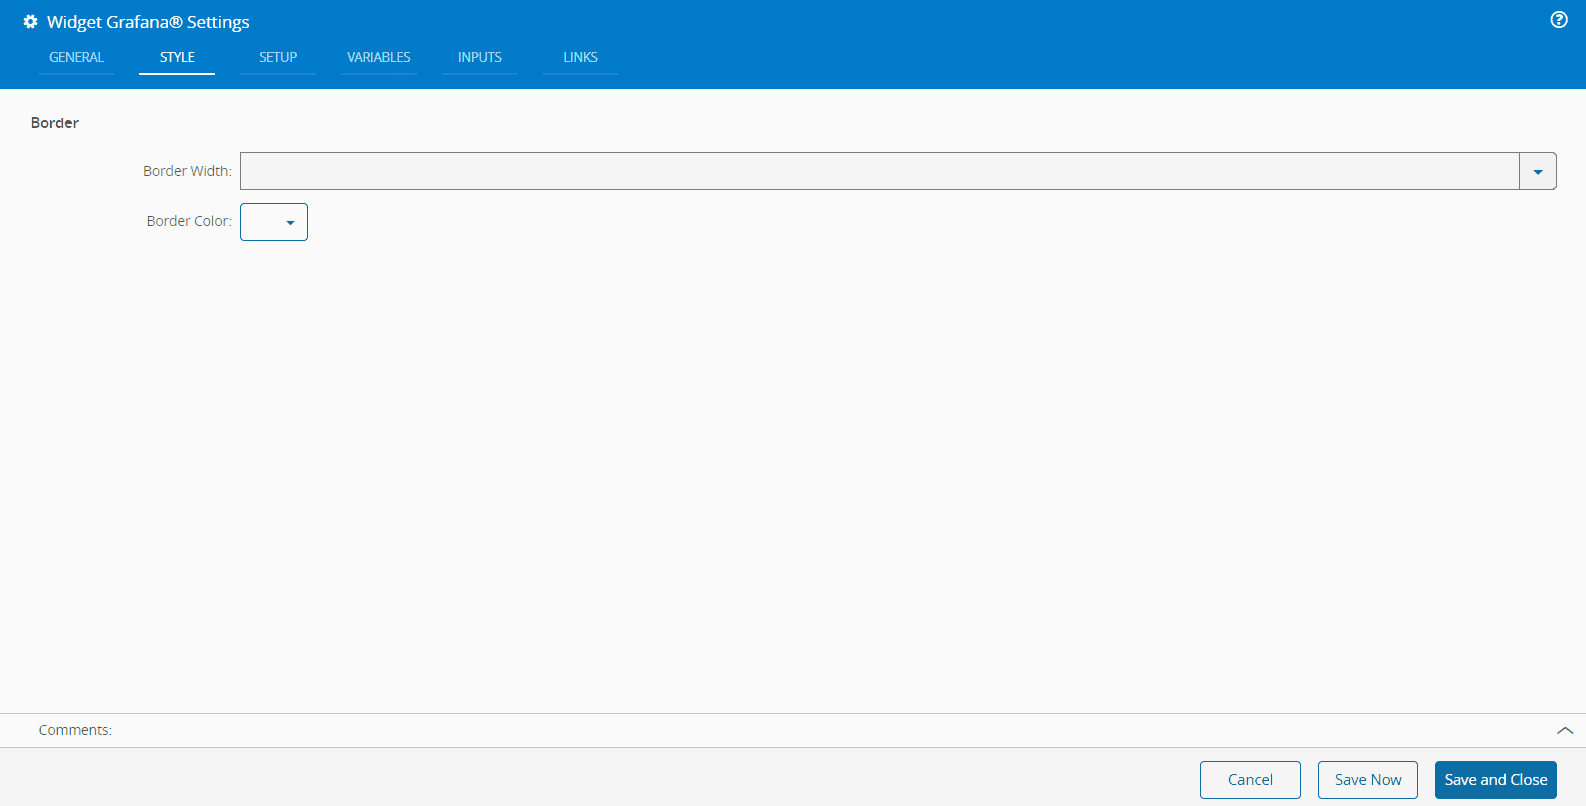
Optionally, in the Style tab, you can define a Border Width and Color.
-
Select the Setup tab and paste the complete address of your recently created Grafana dashboard into the Dashboard Url field.
If Show Controls and Menu is not enabled, the URL will contain
&kiosk.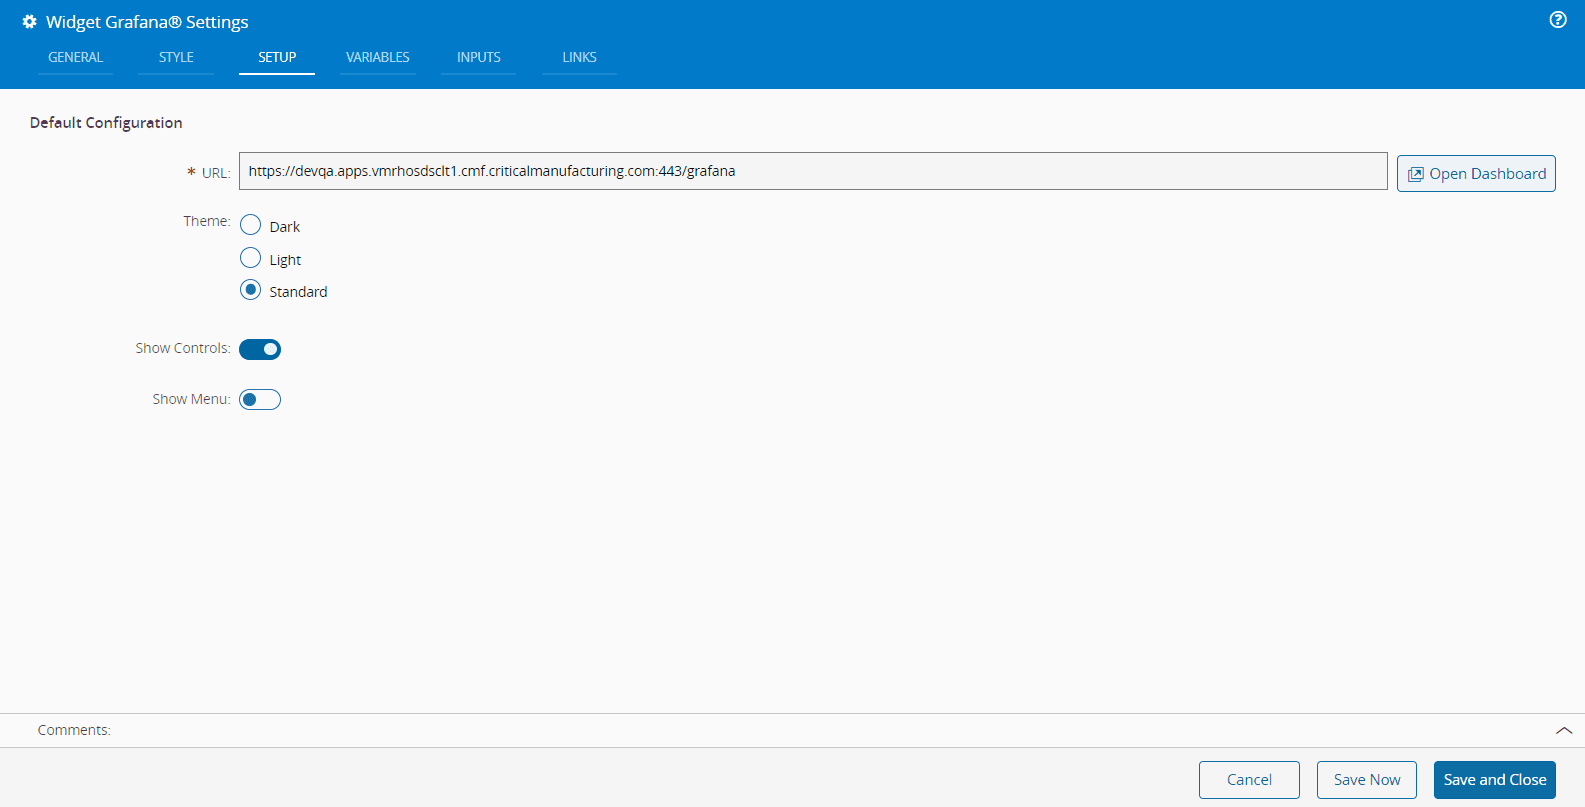
-
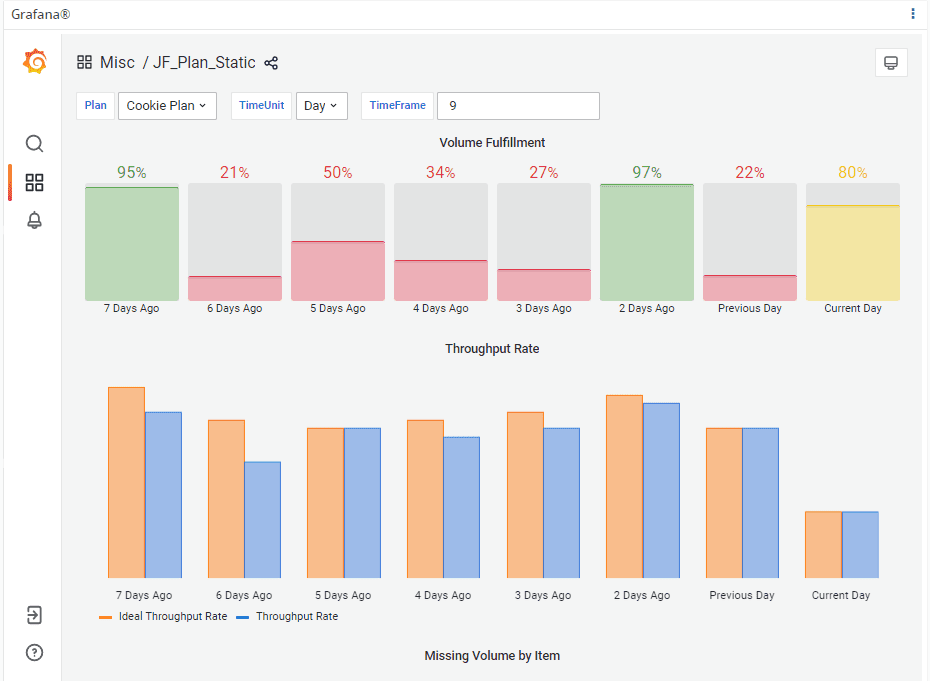
In the Setup tab, you can also select the Theme (Light, Dark, or Standard), and choose whether or not to Show the Controls or the Menu.
-
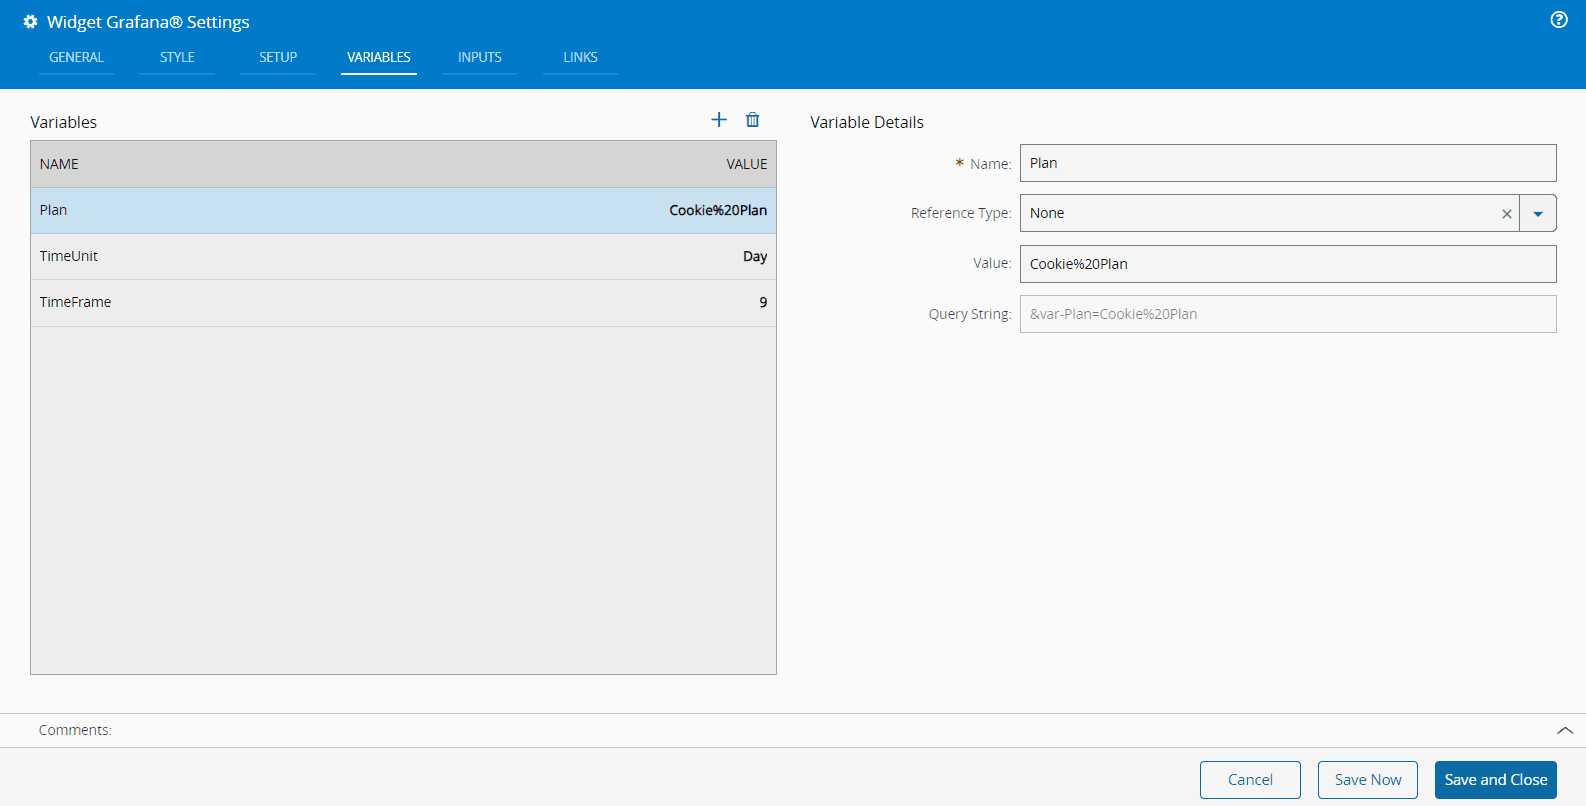
In the Variables tab, you can or override the variables created in Grafana, along with their details:
Note
The Variables you define in the settings are the default ones, but you can introduce other settings from the UI Page into Grafana.
-
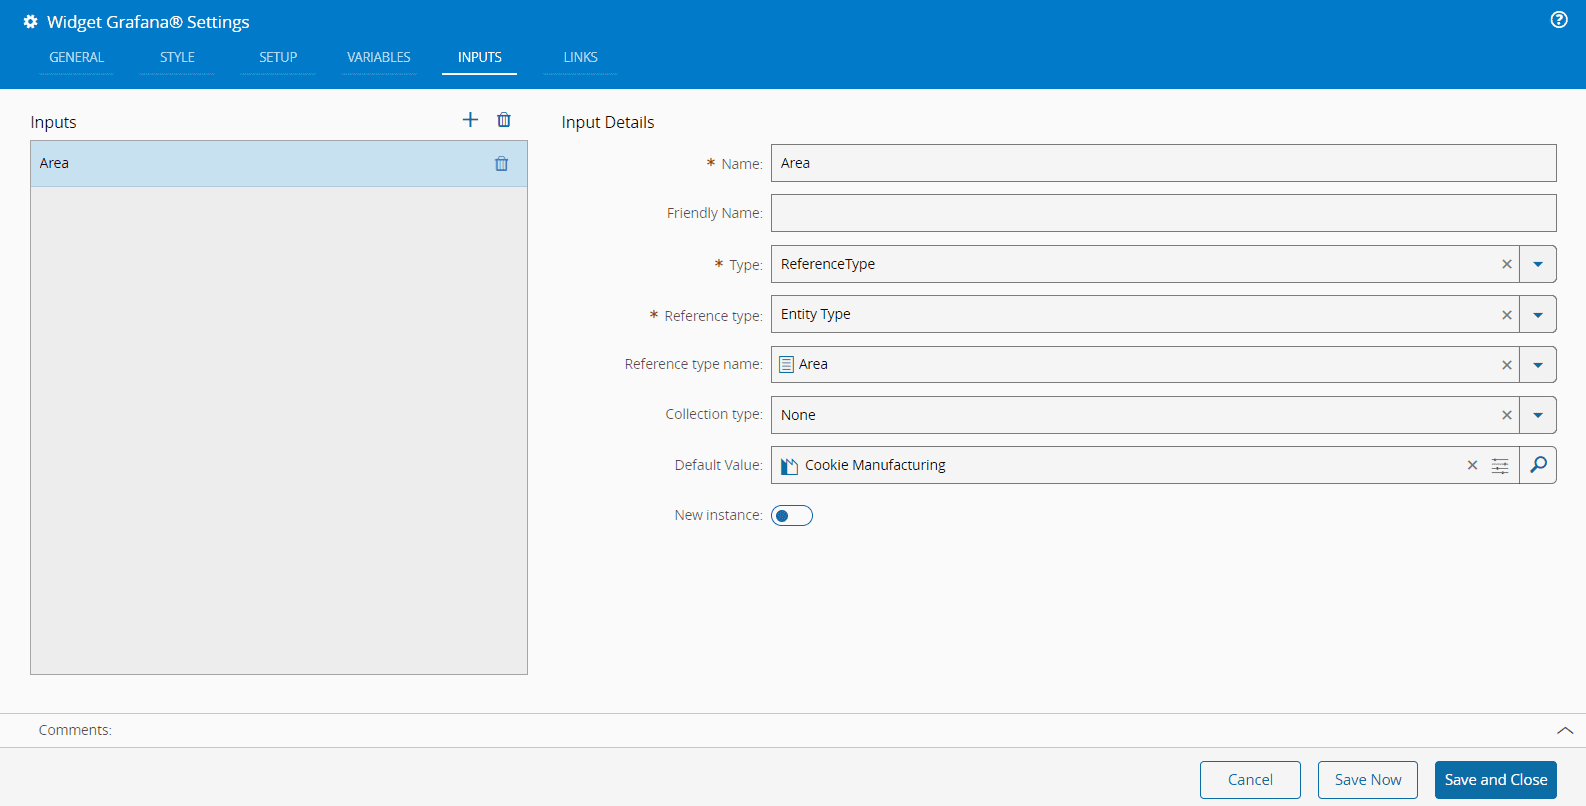
In the Inputs tab, you can inputs as needed. Note that the Name and Type are mandatory fields:
-
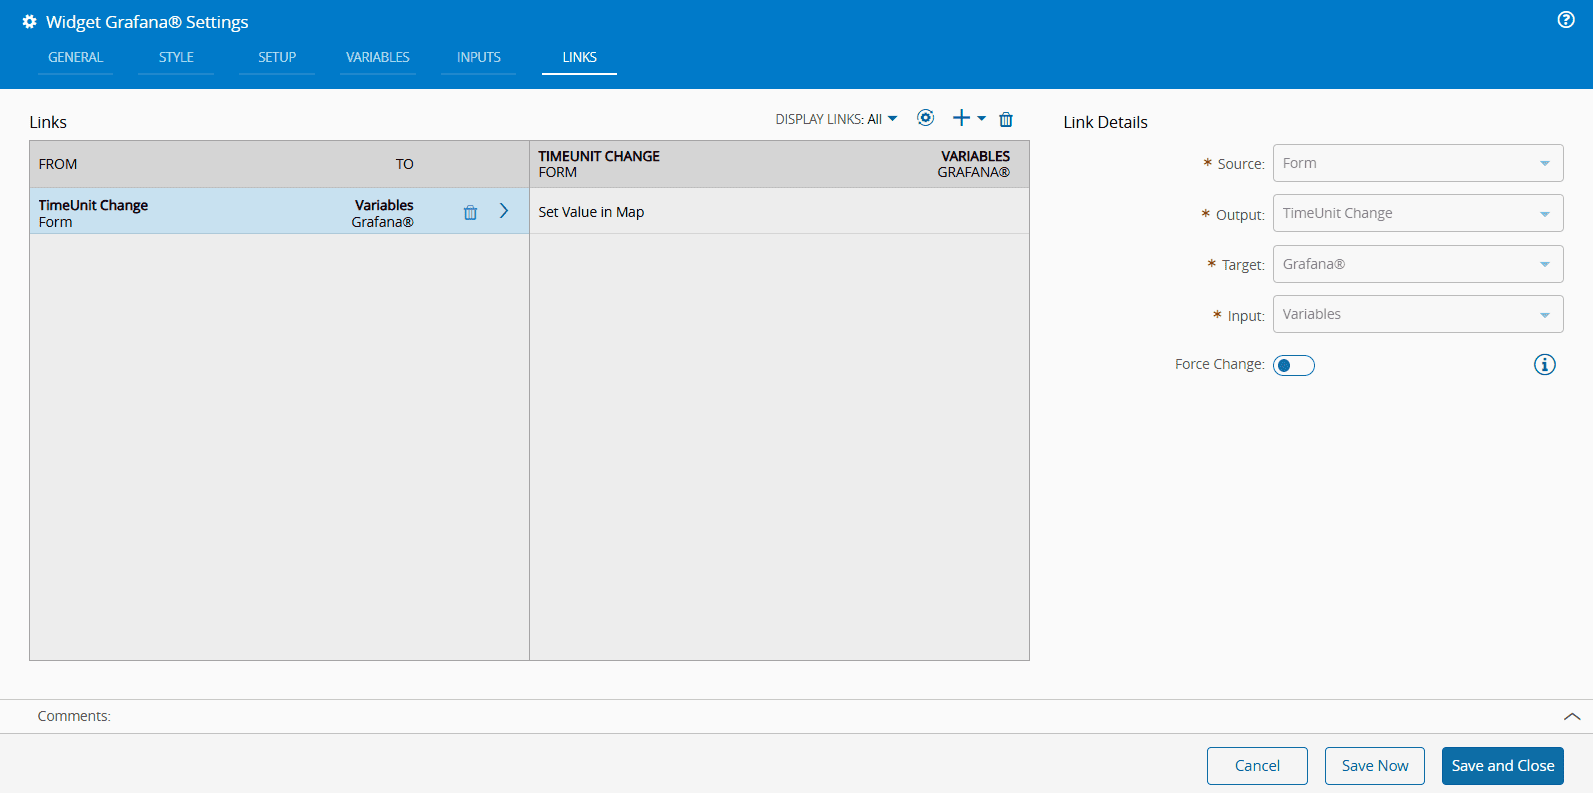
In the Links tab, you can add links to make your UI Page more dynamic.
-
By saving and closing the settings, the widget will be changed accordingly.
Real Use Case#
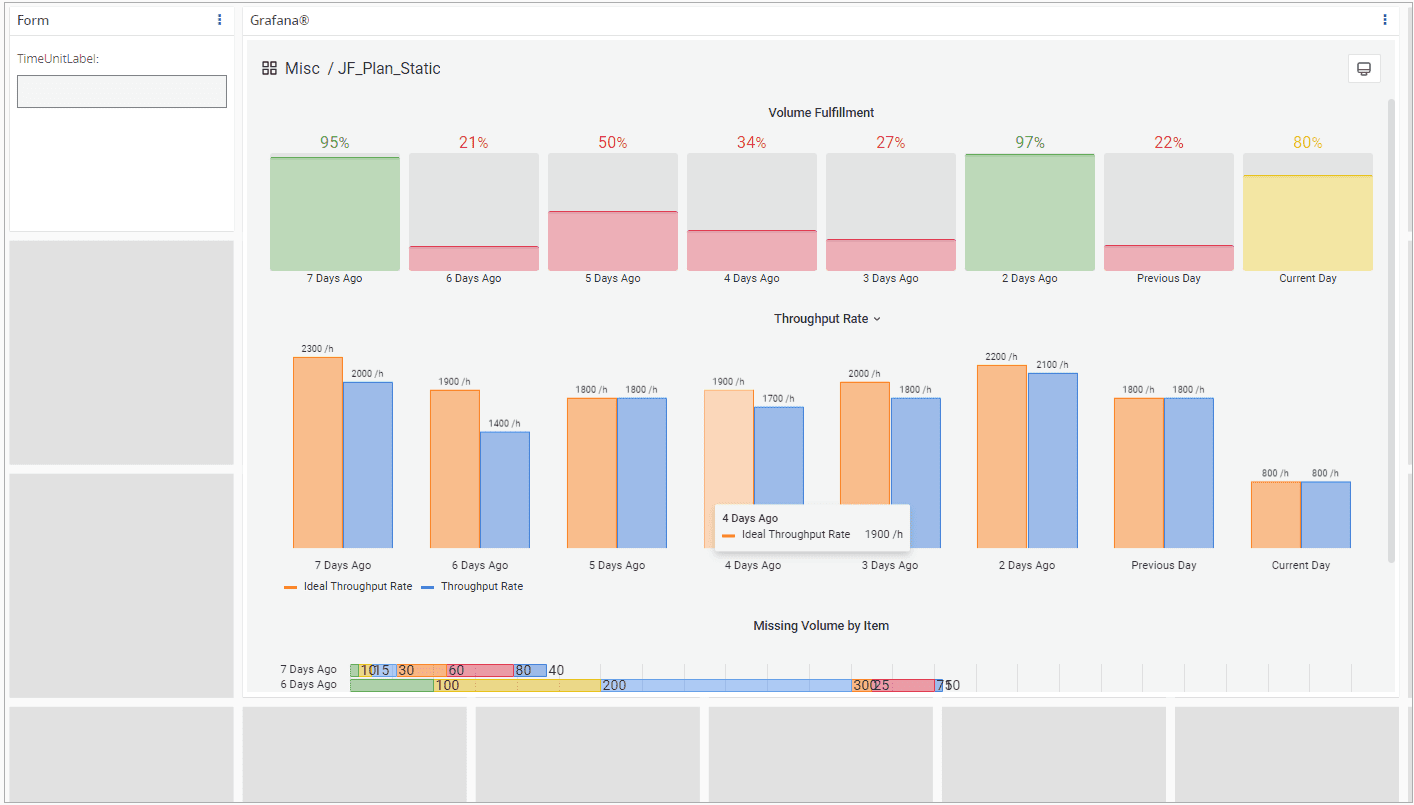
To fully utilize the Grafana widget, you can connect it to a Form widget. Follow the steps below to set it up.
-
Drag and drop the Form widget into your UI Page and select its Settings:
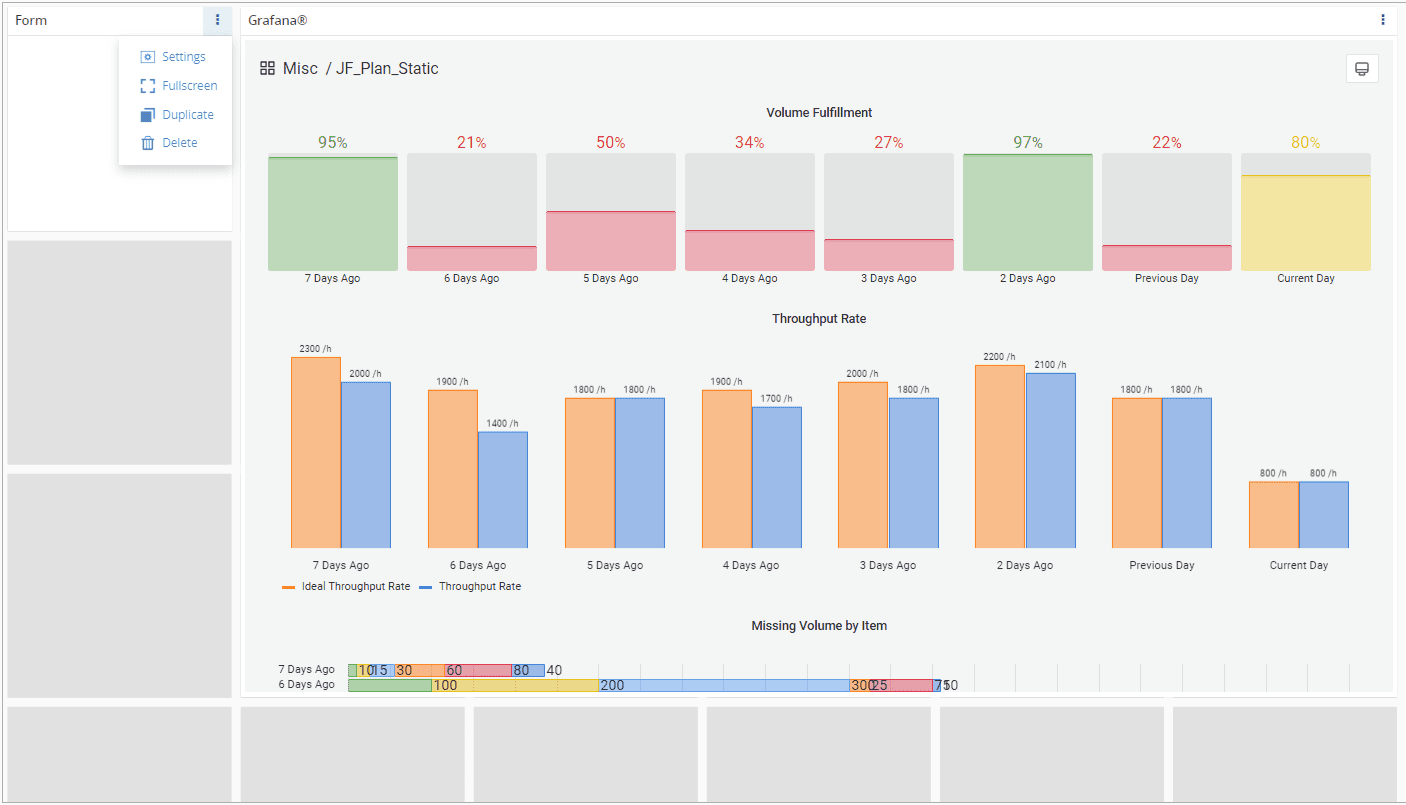
-
Go to the Fields tab, select to change the TimeUnit variable(Type: String), and then Save and Close:
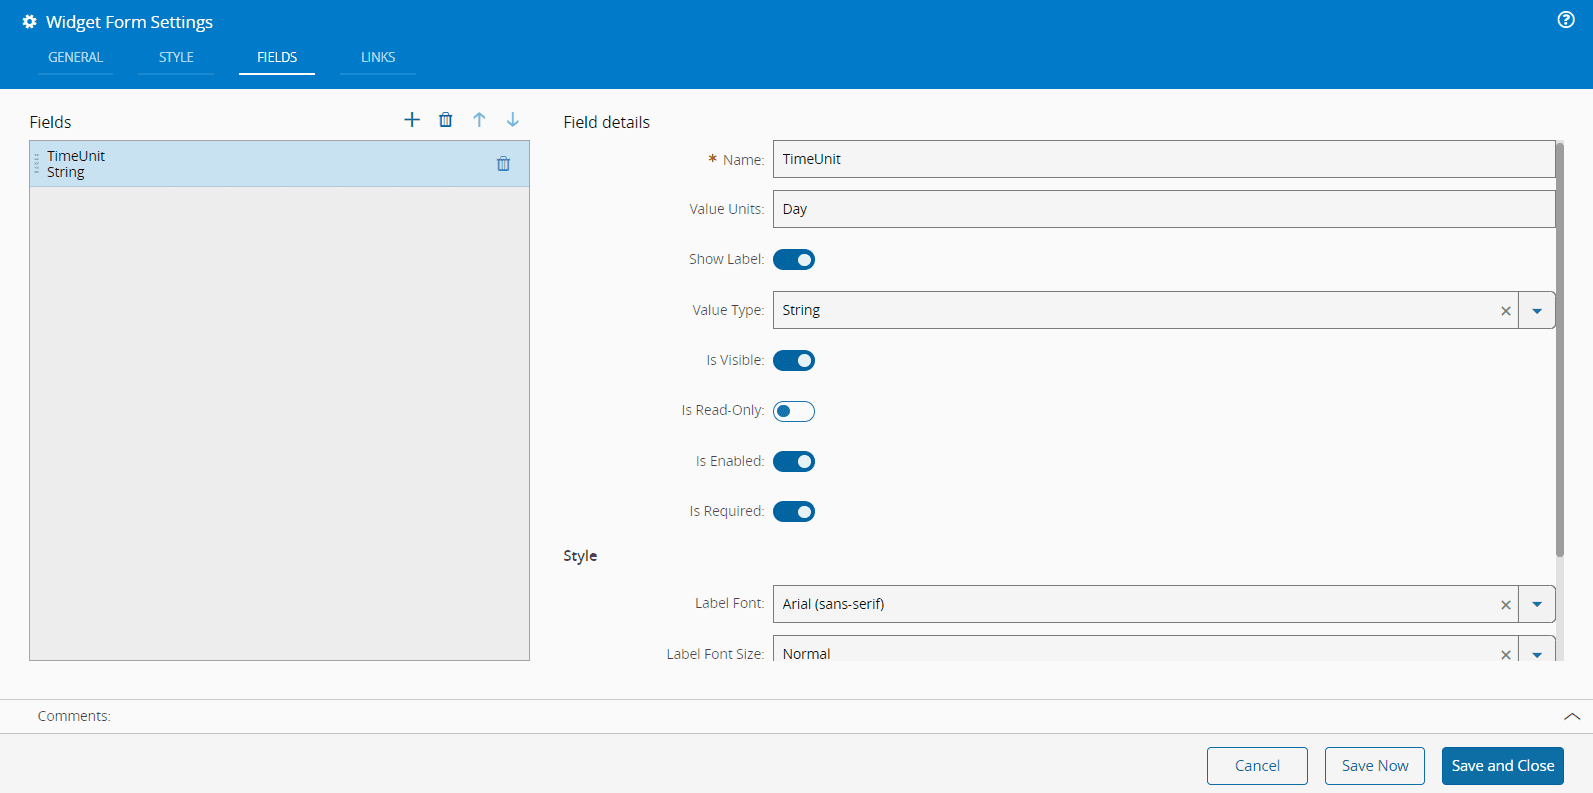
-
In the build mode of your UI Page, define a value for the new TimeUnit:
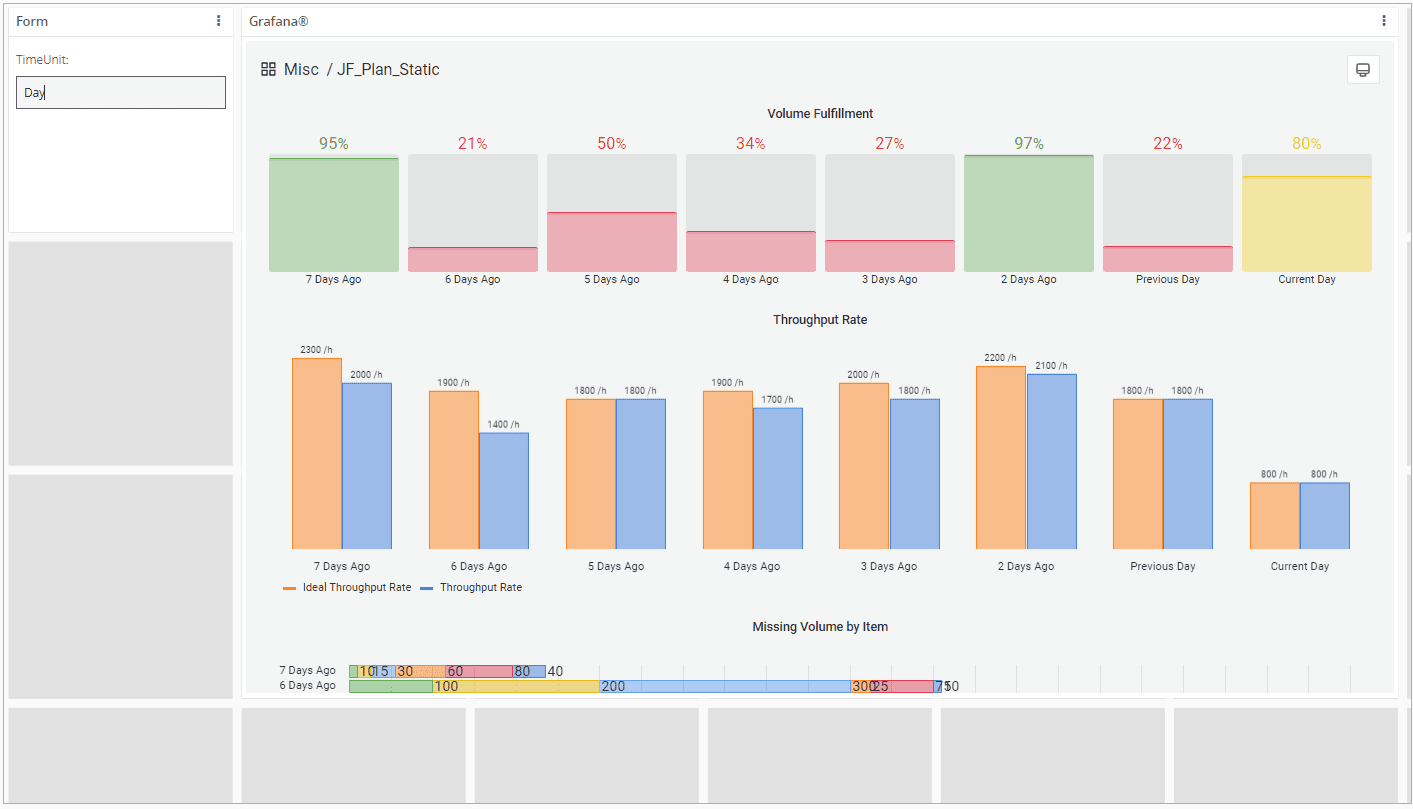
-
In the top ribbon, select Settings, then in the Properties tab, selected to add a new property for your TimeUnit label. Set the appropriate Name, Source, Type, and Value (key of the variable in Grafana), then Save and Close:
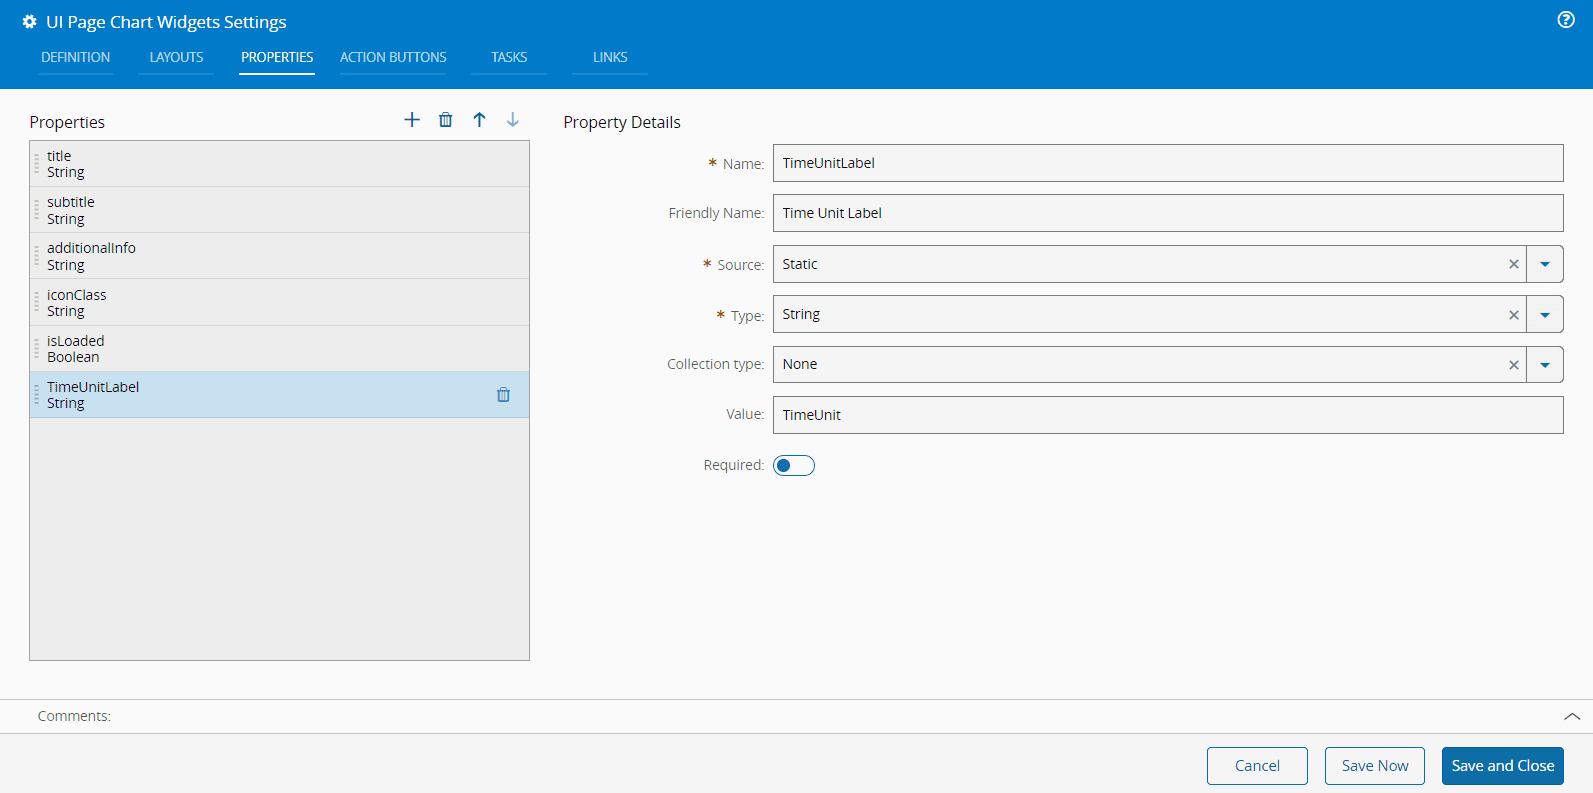
-
Select Links and drag and drop the Forms and Grafana widgets onto your page:
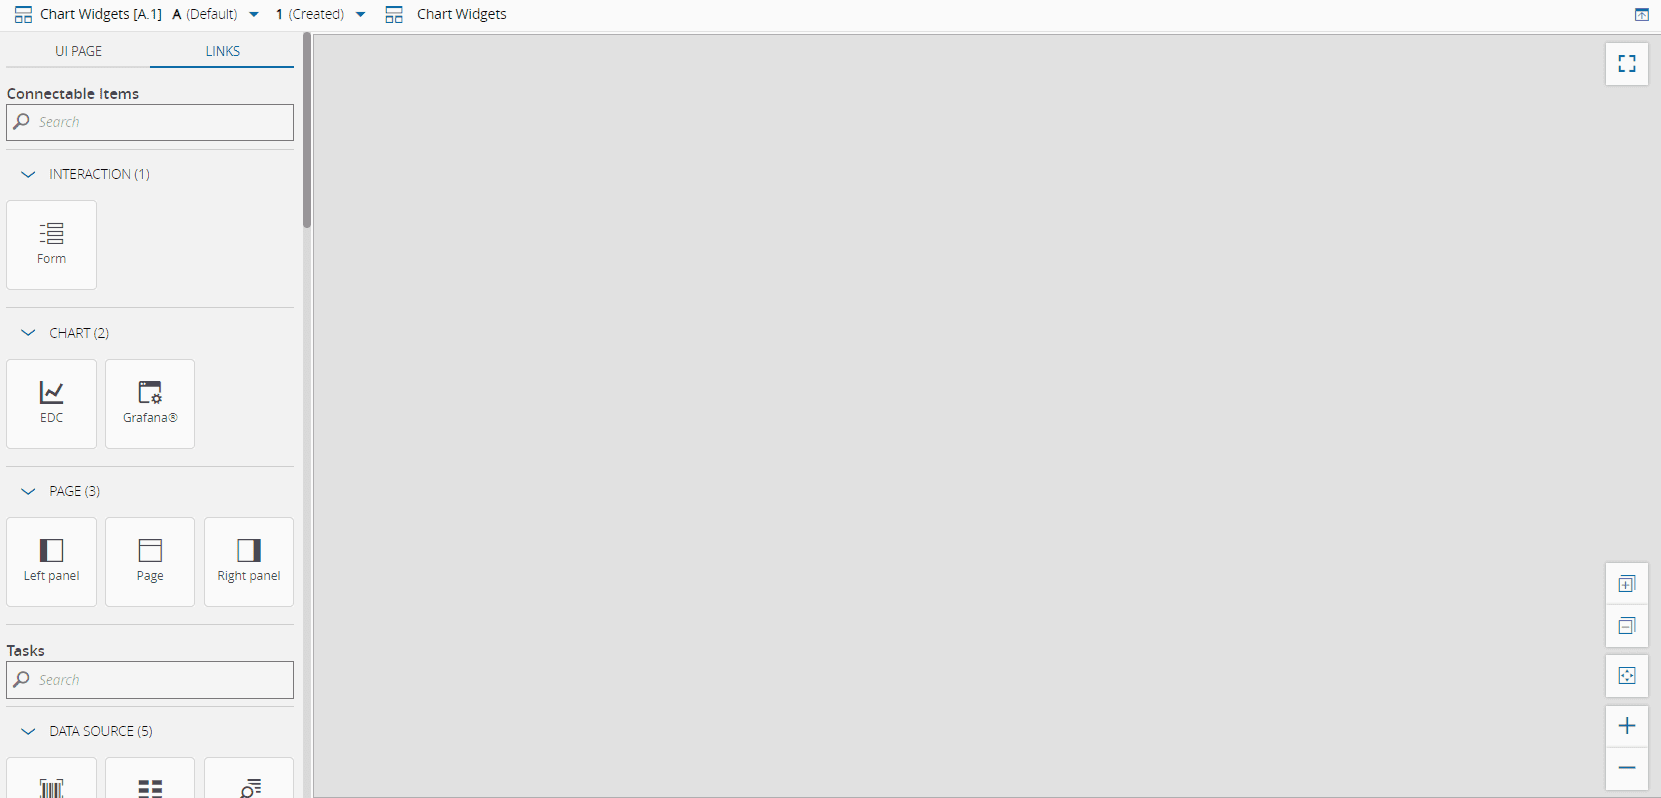
It will look like this:
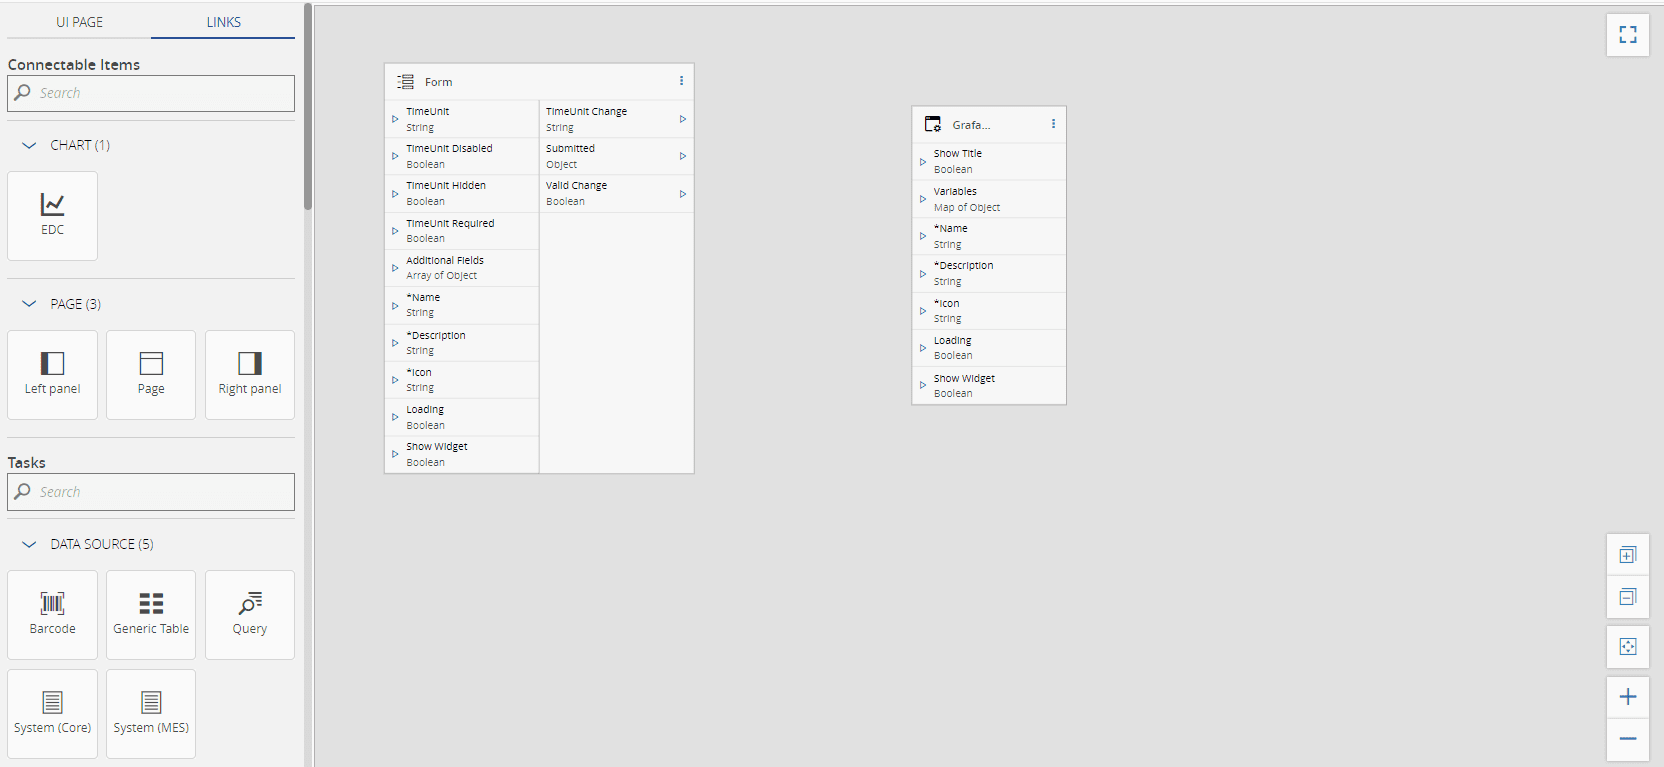
-
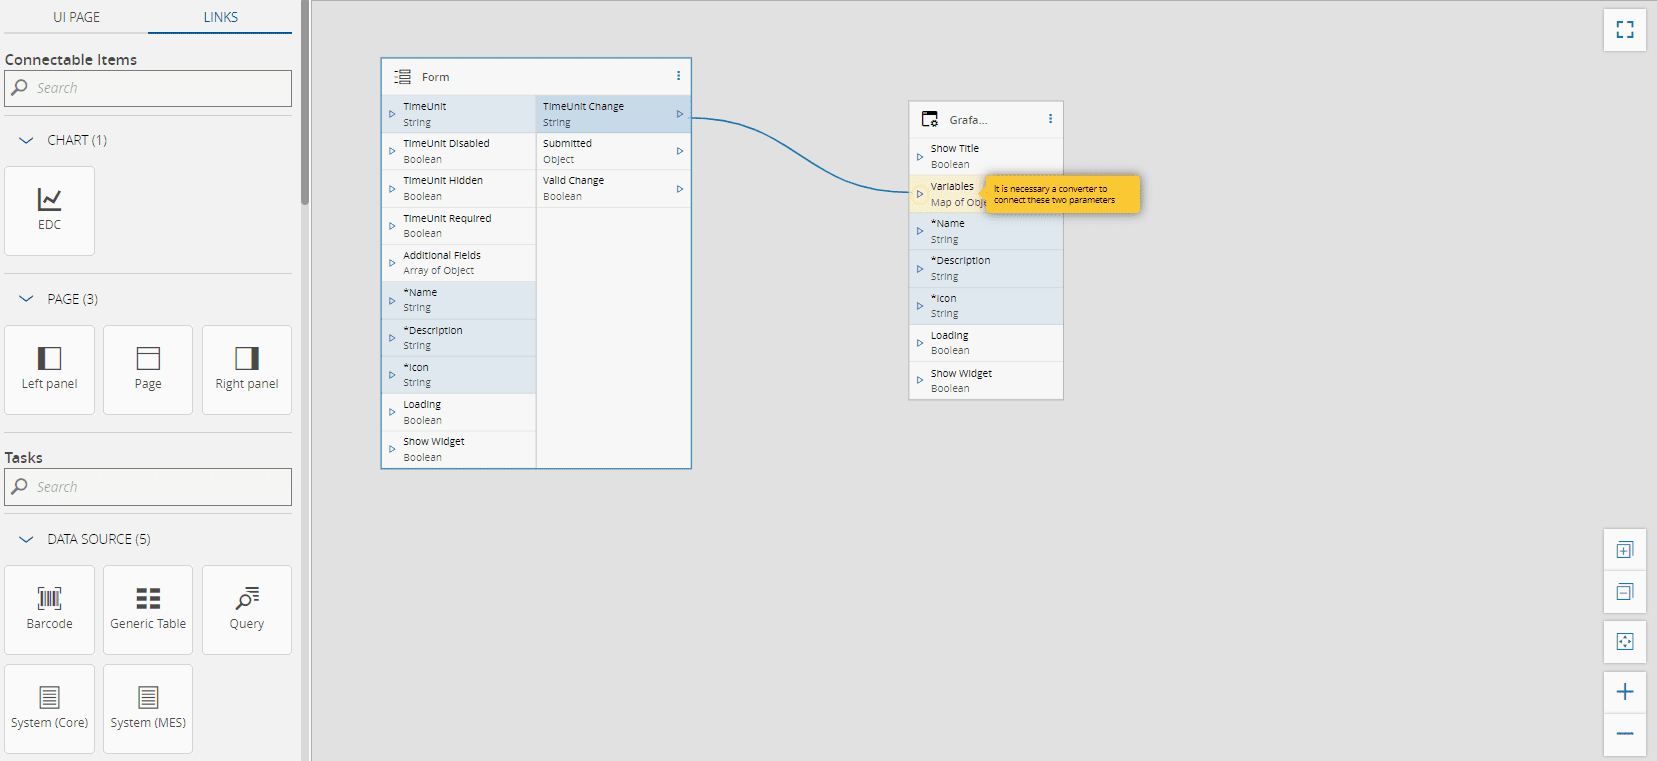
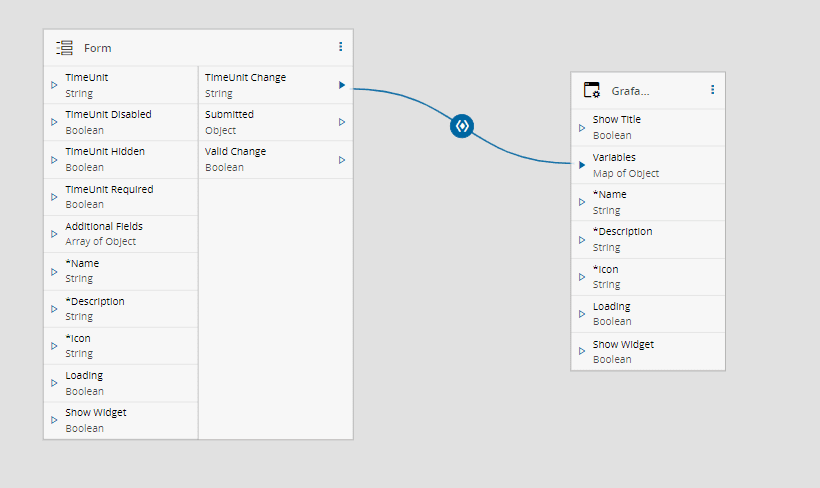
Connect the Form and Grafana widget as shown below:
-
To send the result of the TimeUnitChange String to the variables input of the Grafana widget (a map), select the Converter
Set Value in Mapin Converter and the Property KeyTimeUnitLabel, created earlier, in the Converters wizard: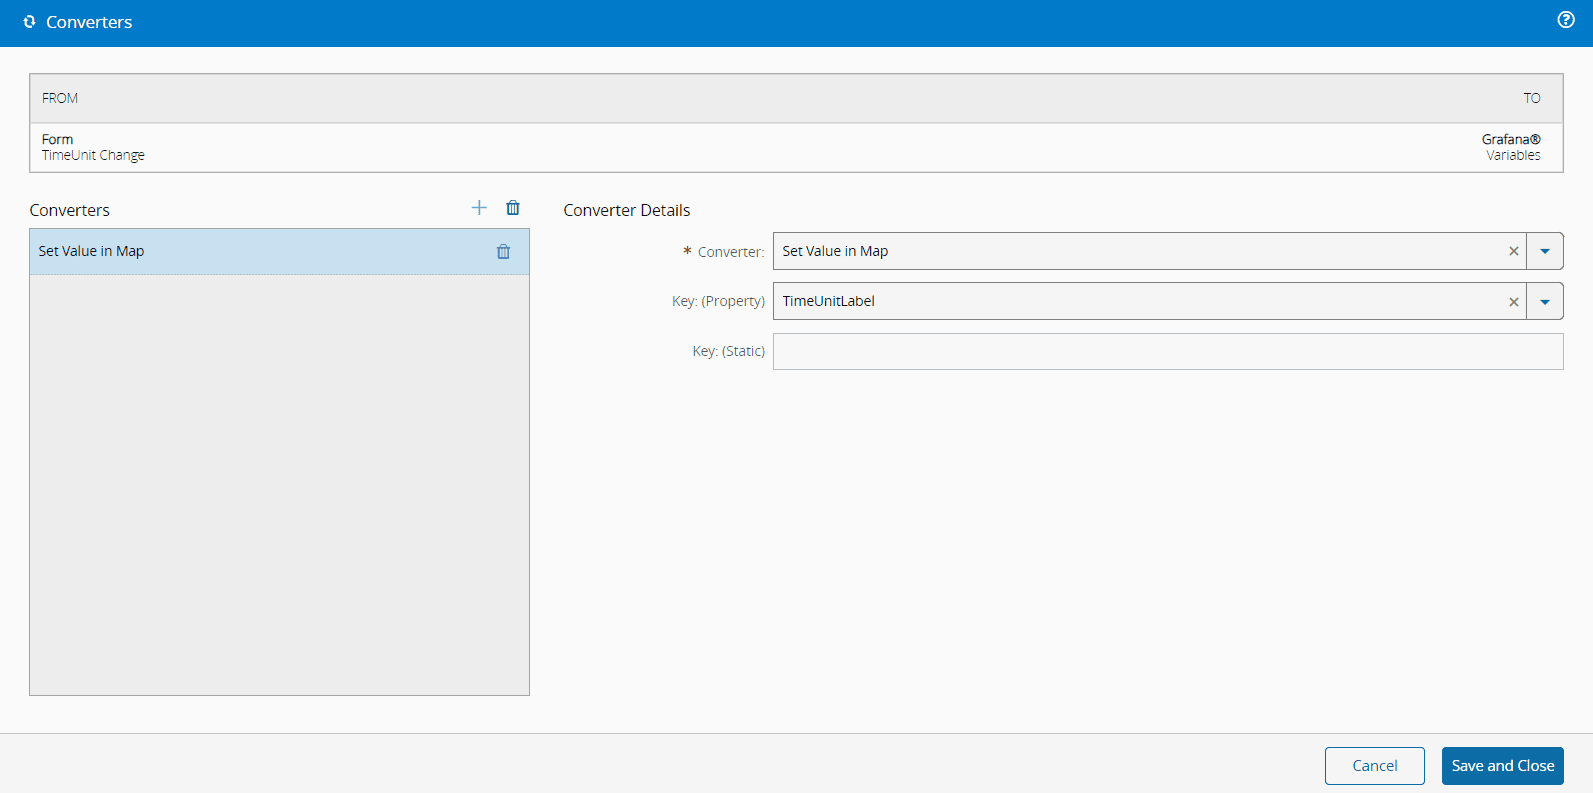
-
Ensure your Links Diagram resembles the image below.
-
To verify your link configuration, select the Settings option of the Grafana widget, access the Links tab, and press icon. If no error message is displayed, your link is correctly configured.
-
By saving and closing the settings, the widget will be updated accordingly.
Info
For more information, see the Data Manager (Grafana Plugin) and Grafana Widget tutorials.