---
alias: user-guide-business-intelligence-dashboard-resource-performance
grafana_json: Library/Build/ConfigFiles/Grafana/MES/dashboards/ResourcePerformance.json
tags:
- dashboards
- resource performance
description: "The dashboard monitors resource performance using key production and operational metrics"
---
# Resource Performance Dashboard
## Overview
The **Resource Performance** dashboard provides information about the operational efficiency of one or more production **Resources** by combining multiple key performance indicators (KPIs). It helps identify performance gaps by comparing actual and potential production, and highlights areas for improvement.
## Folder
Resource History folder.
## Database
DWH (queried via Cube using GraphQL).
## Data
- Production Pieces per Hour (PPH) - production and global
- Yield
- Uptime (in hours and percentage)
- Downtime (in hours and percentage)
- Mean Time Between Failures (MTBF)
- Mean Time To Recovery (MTTRec)
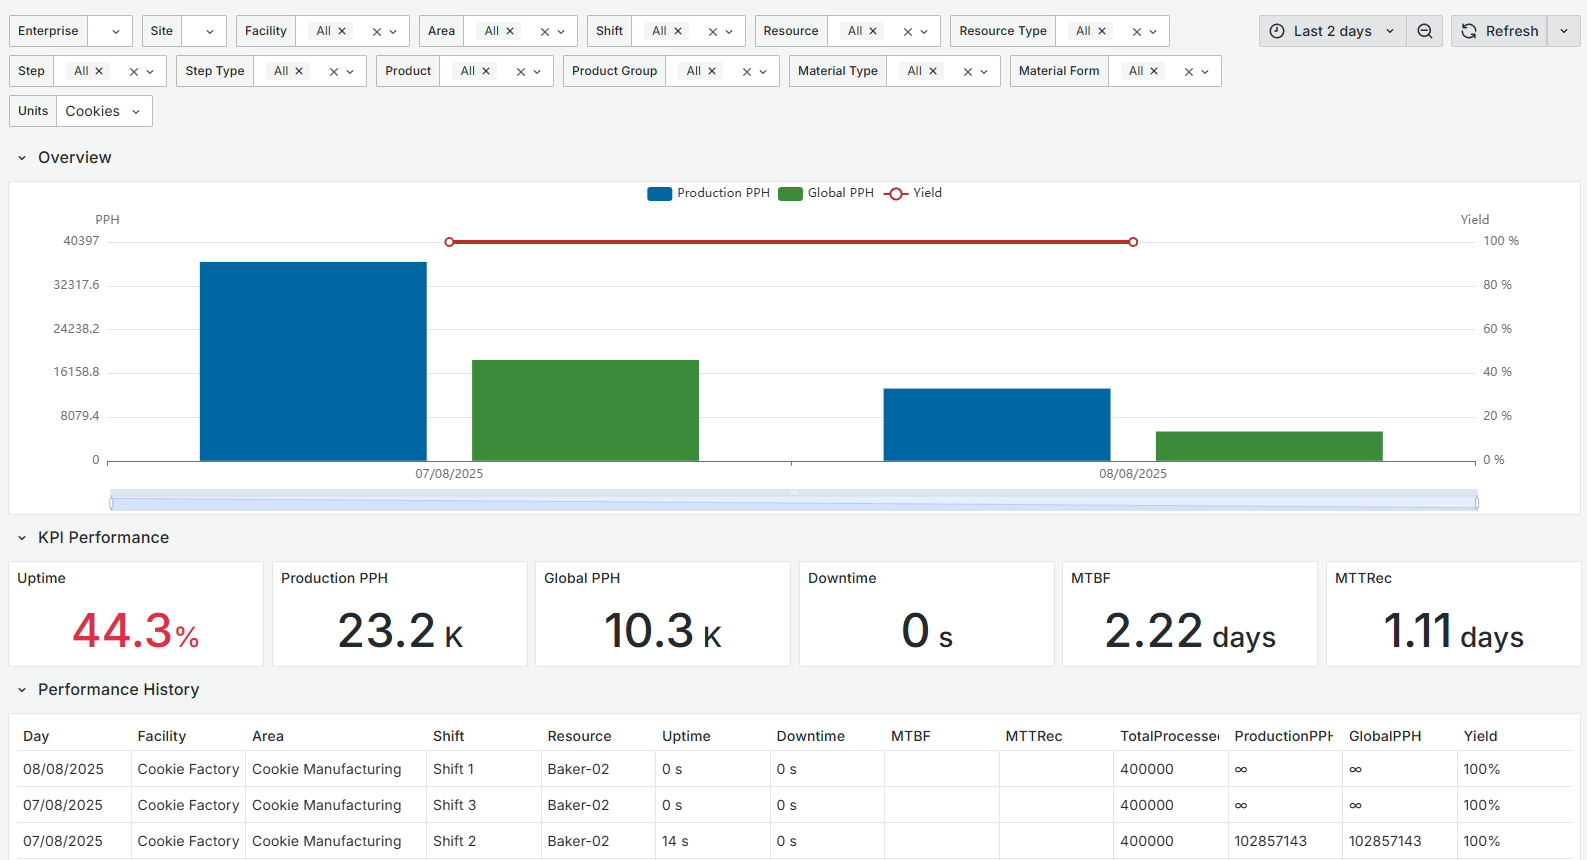
## Example
## Data Breakdown
| KPI | Description | Formula | Datasource |
| - | ----------------- | --- |-------|
| **Production PPH** | Parts produced per hour of productive time for a resource or group. | Processed Primary Quantity ÷ Productive Working Time |`material_movement` in [[user-guide-materialcube]] and `resource_states_non_working_times` in [[user-guide-resourcecube]]|
| **Global PPH** | Average PPH across potential production time. | Processed Primary Quantity ÷ Potential Production Time|`material_movement` in [[user-guide-materialcube]] and `resource_states_non_working_times`in [[user-guide-resourcecube]] |
| **Yield (%)**| Share of processed material that becomes usable output. | (Good units ÷ Total units) × 100|`material_movement` in [[user-guide-materialcube]] |
| **Uptime (%)** | Percentage of time a resource was operational compared to its scheduled time. | (Uptime hours ÷ Scheduled hours) × 100|`resource_states_non_working_times` in [[user-guide-resourcecube]]|
| **Uptime (h)** | Total hours a resource was operational during the selected time period. | Sum of operational times |`resource_states_non_working_times` in [[user-guide-resourcecube]]|
| **Downtime (%)** | Percentage of scheduled time where the resource was unavailable. |(Downtime hours ÷ Scheduled hours) × 100 |`resource_states_non_working_times` in [[user-guide-resourcecube]]|
| **Downtime (h)** | Total hours a resource was unavailable. | Sum of downtimes |`resource_states_non_working_times` in [[user-guide-resourcecube]]|
| **Mean Time Between Failures (MTBF)** | Average system uptime before a failure occurs (time between Unscheduled/Scheduled Down states). It reflects reliability - the higher the MTBF, the more time the equipment stays operational between failures. | (Total available time − Total downtime) ÷ Number of failures | `resource_states` in [[user-guide-resourcecube]]|
| **Mean Time To Recovery (MTTRec)** | Average time it takes to recover from a failure, that is, how long the machine remains unavailable. It reflects recovery efficiency – the lower the MTTRec, the less time equipment remains out of service after a failure. | Total downtime ÷ Number of failures |`resource_states` in [[user-guide-resourcecube]]|
## Data Visualization
| Panel | Description | Threshold Values| Datasource |
|-------|-------------|----------------|------------|
|**Overview**| Displays the Production PPH, Global PPH, and Yield over the selected time range. High Production PPH with a narrow gap to Global PPH means resources are operating near full potential. Yield close to 100% indicates strong process quality.| Production PPH ≥ 80% of Global PPH, Yield ≥ 98%. |`resource_states` and `resource_maintenance` in [[user-guide-resourcecube]]|
|**KPI Performance** | Shows current summary metrics for the selected time range: Uptime (%), Production PPH, Global PPH, Downtime, MTBF, and MTTRec.These indicators provide a quick overview of the resource's performance and condition.| **Uptime:** red < 80%, yellow ≥ 80%, green ≥ 90%
**Production PPH & Global PPH:** Production PPH ≥ 80% of Global PPH
**MTBF** as high as possible
**MTTRec** as low as possible. |`resource_states` and `resource_states_non_working_times` in [[user-guide-resourcecube]], and `material_movement` in [[user-guide-materialcube]]|
|**Performance History** | Breakdown of daily resource performance, including Uptime, Downtime, MTBF, MTTRec, Total Processed, Production PPH, Global PPH, and Yield. Pinpoints days or shifts where performance deviated from targets, enabling root cause analysis| Consistent values with minimal downtime, stable or improving PPH, and high yield across all days/shifts. |`resource_states` and `resource_states_non_working_times` in [[user-guide-resourcecube]], and `material_movement` in [[user-guide-materialcube]]|
## Entity Filters
Single selection
- Enterprise
- Site
Multiple/All selection
- Facility
- Area
- Shift
- Resource
- Resource Type
- Step
- Step Type
- Product Group
- Product
- Material Type
- Material Form
- Units
{% include-markdown 'includes/pages/dashboards_filter_options.md' %}