Analytics Views#
 Analytics.Reports
AnalyticsViews.Show
The Analytics Views are categorized into two types - Reports and Dashboards - indicated by the icons and , respectively. While the Dashboards are built using Grafana, Reports are generated using SQL Server Reporting Services or Stimulsoft. Stimulsoft reports are labeled with a New Design badge in the bottom-right corner of the report tile.
SQL Server Reporting Services
Support for SQL Server Reporting Services will be deprecated in version 12.0. It is strongly recommended to migrate to ClickHouse-based Analytics Views, which offer significantly better performance, scalability, and modern visualization capabilities.
The top bar of the Analytics Views provides options to switch between a grid or list layout using the and icons, respectively.
You can refine the displayed results using filters such as Terminated, Only New Design, and Editable. The Type filter allows you to display only Reports, only Dashboards, or all available views.
In list view, the Analytics Views provide a clear overview of which items are Reports or Dashboards, and which are Editable. By default, system Analytics Views are not editable. To modify these permissions, see Analytics Views Security Permissions.


The standard Analytics Views are organized in the following structure:
Material History - Material History analytics views
- Material Genealogy (New Design) - This report provides information about Material's Genealogy with an updated design.
- Material Genealogy - This report provides information about Material's Genealogy.
- Material History - This report provides access to the Material History report of any Material which is available in the Operational Data Store (ODS) database.
- Material History (from XML) - For long term retention purposes Critical Manufacturing allows that the Material history is exported to an XML file to a configured directory. The Material History (from XML) report provides access to the Material Detailed History reports for Materials which have been previously archived and for which the XML files exist in the configured directory (defined in the application configuration entry
/Cmf/System/Configuration/Reporting/HistoryArchiving/XMLImportBaseFolder). - Material History (New Design) - This report enables you to customize some of information provided in the Material History report, which is available for any Material in the Operational Data Store (ODS) database.
- Material Operations History - This dashboard provides a detailed overview of all material-related transactions executed within a selected time range. It enables you to trace and analyze key process data, such as quantities, units, material genealogy, and production context, including step, area, and resource. It also allows historical audits, traceability checks, and operational performance analysis based on the material operations recorded in the system.
Material Logistics - Material Logistics analytics views
- Package Contents Report - This report provides a hierarchical view of a package and all nested packages it contains. It displays key information such as package identifiers, quantities, products, and material composition.
- Periodic Inventory Details - This report provides information about a specific Periodic Inventory.
- Pick List Details - This report provides information about a specific Pick List.
- Transfer Order Details (New Design) - This report displays details regarding a transfer order’s attributes and associated items.
- Transfer Order Details - This report provides information about a specific Transfer Order.
- Transfer Requirement Details Report - This report provides information about a specific Transfer Requirement. It enables progress tracking, helps identify bottlenecks, and ensures accuracy when making logistics decisions.
Performance - Dynamic operational indicators for a given time interval
- Area Maintenance Information - Dashboard highlighting MTBF, MTTRec, MTTA, and MTTRep trends and worst offenders across resources in an area.
- Future Flow Report - This report details the future steps and details for a specified product or material, allowing users to filter and view related information from various operations.
- Maintenance Information - Dashboard covering corrective and preventive MAOs plus reliability KPIs to support maintenance planning.
- Material Facility Cycle Time DWH - Report showing how long materials take to run through each facility so you can spot cycle-time bottlenecks.
- Material Losses DWH - Report listing loss quantities and reasons to analyze yield erosion across facilities, areas, steps, and products.
- Material Pass Test Results DWH - Report detailing material defects with First Pass Test and First Pass Yield indicators per resource.
- Material State Time Distribution DWH - Report breaking down how each material spends time in different states over the selected period.
- Material Step Cycle Time DWH - Report measuring step-level cycle time to identify slow operations and improvement opportunities.
- Material Volume and Yield DWH - Report providing volume and yield metrics for the chosen interval, including optional Pareto charts per step.
- Material Yield Loss DWH - Report calculating yield loss percentages and absolute quantities with flexible filtering dimensions.
- OEE Information - Dashboard delivering a real-time OEE view that combines availability, performance, and quality for selected resources.
- Plan Information Dashboard - This dashboard helps monitoring planned versus actual production volume and overall plan fulfillment.
- Product Delivery - Dashboard monitoring production order execution and delivery timeliness to keep customer commitments on track.
- Production Performance - Dashboard presenting current shop-floor performance status with key throughput and stability indicators.
- Resource Efficiency - Dashboard tracking resource efficiency, OEE, downtime, and maintenance KPIs across a chosen period.
- Resource Maintenance Information - Dashboard monitoring MTBF, MTTRec, MTTA, and MTTRep KPIs for individual resources with historical trends.
- Resource OEE History - Dashboard exploring historical Overall Equipment Effectiveness so you can compare resource performance over time.
- Resource OEE DWH - Report analyzing resource OEE components and supporting Pareto charts to prioritize improvement actions.
- Resource Performance DWH - Report showing how each resource performs across the selected timeframe, including productivity metrics.
- Resource State Time Distribution DWH - Report detailing how resources spend time in each state to reveal utilization and downtime patterns.
- Step Cycle Time - Dashboard visualizing processing time per production step to surface bottlenecks and variability.
- Step Overview - Dashboard combining performance and loss analysis for a specific step to expose inefficiencies and failure drivers.
- Yield Loss Information - Dashboard analyzing material loss patterns and yield deviations throughout the production flow.
Quality - Quality related reports
- Protocol Instance History - This report provides traceability of protocol execution, including states, tasks, materials, documents, parameters, and related activities for a specific protocol instance.
- Protocol Instance History - This reports provides access to the Protocol Instance History report for any Protocol Instance in the Operational Data Store (ODS).
- Quality Information - The Quality Information dashboard provides insights into product quality performance. It helps detect recurring quality issues, prioritize root-cause analysis, and improve overall process reliability.
- Scrap Information - The Scrap Information dashboard provides insights about Material losses in the system. It supports production analysis, identification of recurring scrap causes, and prioritization of areas with the most significant impact on material yield.
Resource History - Resource History reports
- Maintenance History Dashboard - This dashboard provides information about the Maintenance History for one or more Resources.
- Maintenance History Report (New Design) - This report generates a customizable history of resource data, allowing users to filter and view related information from various maintenance activities.
- Maintenance History - This report provides information about the Maintenance History for one or more Resources.
- Resource History - This report provides information about a Resource History.
- Resource Performance Dashboard - The Resource Performance dashboard provides information about the operational efficiency of one or more production **Resources by combining multiple key performance indicators (KPIs). It helps identify performance gaps by comparing actual and potential production, and highlights areas for improvement.
State - snapshot information about the current system state
- Materials
- Material Aggregated Inventory - This report displays aggregated information about the current material in progress.
- Material Detailed Inventory - This report displays detailed information about the current material in progress.
- Resources
- Resource Aggregated State - This report displays aggregated information about the current state of the resources.
- Resource Detailed State - This report displays detailed information about the current state of the resources.
- Resource State Time Distribution Dashboard - The Resource State Time Distribution dashboard provides information on how production Resources spend their time in different operational states over a selected period, enabling performance monitoring, downtime analysis, and resource utilization assessment.
System - application monitoring information
- Service Performance - This report displays information about the services which take the most time.
To access a particular report, it is only necessary to navigate in the tree and click on the desired report.
Costing - costing history and forecast.
- Material Cost Dashboard - This dashboard forecasts the material cost.
- Product Cost Dashboard - This dashboard forecasts the product cost.
- Material Cost History - This dashboard allows you to monitor the cost evolution of materials over time, including detailed comparisons between the old and new cost values for both main and sub-materials.
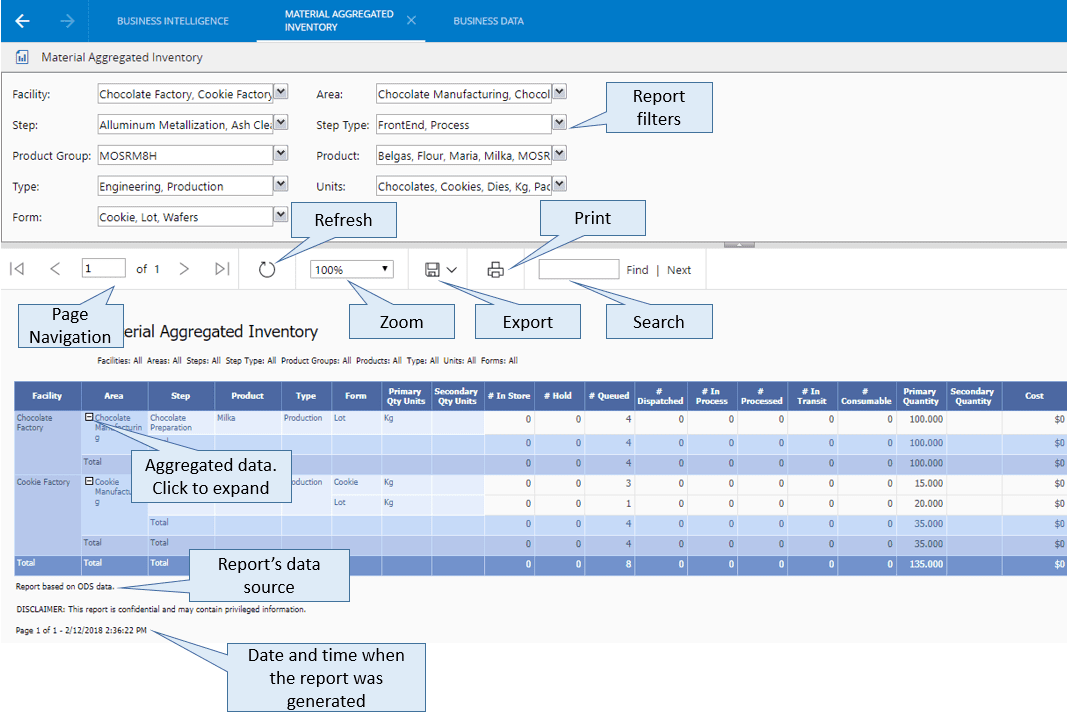
To display the report press View Report. Once the report is displayed, one can:
- Move between pages
- Zoom in and zoom out
- Search for an item
- Export the report, by clicking on the Export button and selecting the desired format
- Print the report, by clicking on the Print button
- Drill-down by clicking on the '+' boxes
Info
When multiple selection filters are available, selecting all the options is the same as making no filter
Info
To access the analytics views tree, you need permission to the report server. For more information, see the Report Folders section in the User Guide.