---
alias: user-guide-business-intelligence-dashboard-oee-information
grafana_json: Library/Build/ConfigFiles/Grafana/MES/dashboards/OEEInformation.json
tags:
- dashboard
description: "This dashboard details the Overall Equipment Effectiveness (OEE) and provides insights on resource performance and efficiency metrics"
---
# OEE Information
## Overview
The **OEE Information** dashboard provides a real-time overview of the performance and efficiency of one or more **Resources**.
## Folder
* Performance
## Database
* DWH (queried via Cube using GraphQL)
## Data
* OEE - Overall Equipment Effectiveness (%)
* Availability (%)
* Quality (%)
* Performance (%)
* Rate Efficiency (%)
* Operational Efficiency (%)
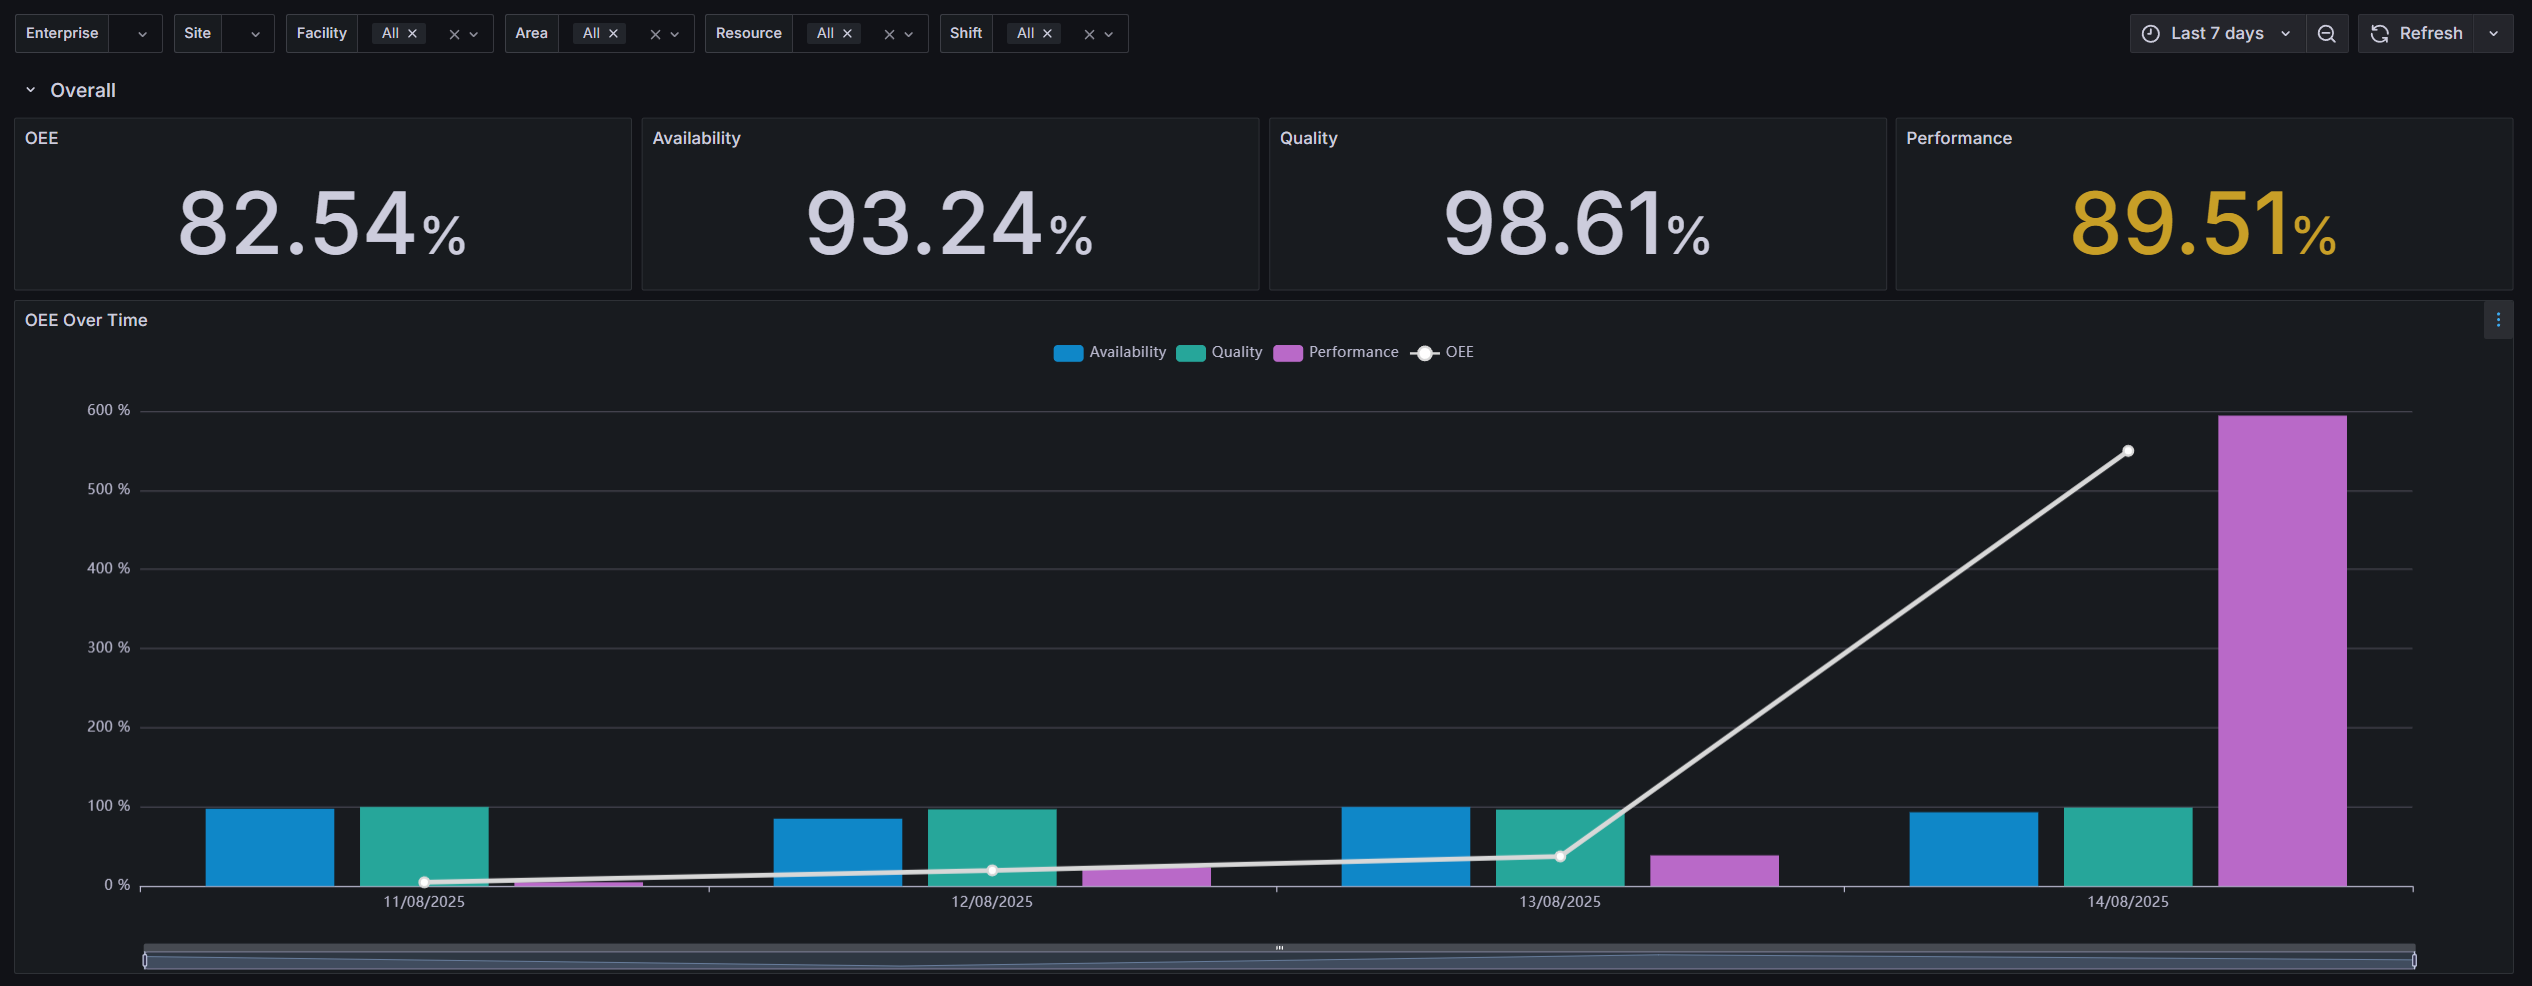
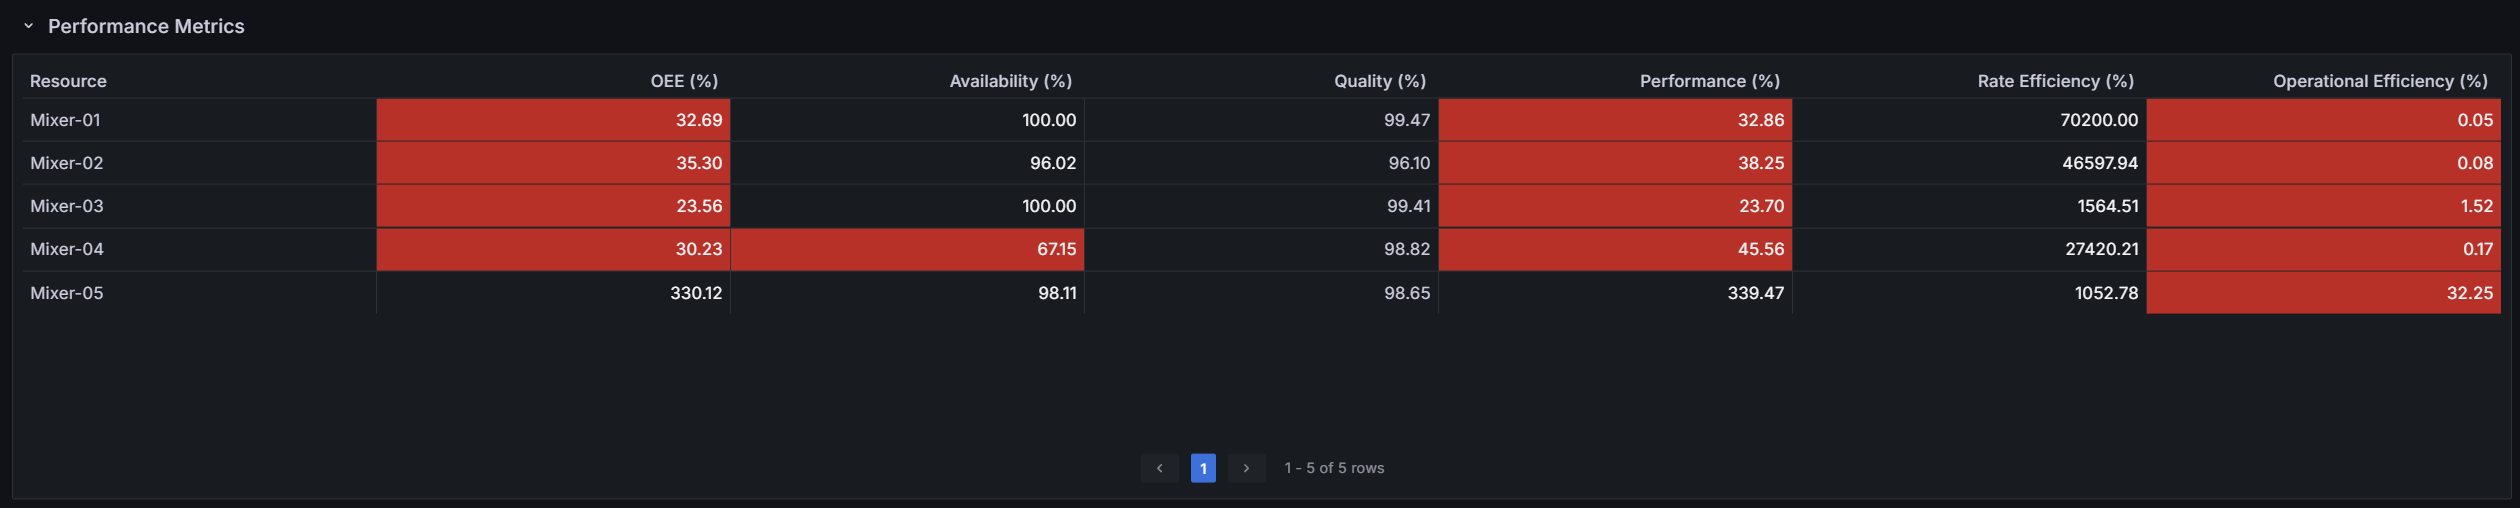
## Example
## Data Breakdown
| KPI | Description | Formula | Datasource |
| - | ------ | --- | ------ |
| **OEE - Overall Equipment Effectiveness** | Measures equipment effectiveness based on Availability, Performance, and Quality. | Availability x Performance x Quality | `resource_states_non_working_times` in [[user-guide-resourcecube]]|
| **Availability** | Indicates how much of the scheduled production time a resource was operating, excluding downtime. | Operating Time ÷ Potential Production Time x 100 | `resource_states_non_working_times` in [[user-guide-resourcecube]]|
| **Quality** | Measures the percentage of good (non-defective) units produced compared to the total units processed. | Total Processed Primary Quantity ÷ (Total Processed Primary Quantity + Total Primary Quantity Losses) x 100 | `material_movement` in [[user-guide-materialcube#material-movement]]|
| **Performance** | Measures how efficiently a Resource operates by comparing the actual operating speed to its ideal cycle time during productive time. | Ideal Cycle Time ÷ Operating Time x 100 | `resource_states_non_working_times` in [[user-guide-resourcecube]]|
| **Rate Efficiency** | Indicates the efficiency of the operating speed of a Resource compared to its ideal rate during the period. | Ideal Cycle Time ÷ Net Operating Time x 100 | `resource_states_non_working_times` in [[user-guide-resourcecube]]|
| **Operational Efficiency** | Measures the proportion of actual productive time a resource uses compared to total operating time available, excluding planned and unplanned downtime. | Net Operating Time ÷ Operating Time x 100 | `resource_states_non_working_times` in [[user-guide-resourcecube]]|
## Data Visualization
| Panel | Description | Threshold Values | Datasource |
|-------|------|-----|------------|
| **Overall** | Contains key statistics and a summary chart. The available metrics (four) evolve over time. | Color threshold:
- Values below 80% are red.
- Values between 80% and 90% are yellow.
- Values above 90% are not highlighted.
Additionally, the OEE metric is less demanding and has a deviation of 10% in relation to the other thresholds. | `resource_states_non_working_times` in [[user-guide-resourcecube]]
`material_movement` in [[user-guide-materialcube#material-movement]]|
| **Performance Metrics** | Features a resource-oriented table. | Color threshold:
- Values under 80% have a red background.
Additionally, the OEE metric is less demanding and has a deviation of 10% in relation to the other threshold.| `resource_states_non_working_times` in [[user-guide-resourcecube]]|
## Entity Filters
### Single Selection
* Enterprise, Site
### Multiple/All Selection
* Facility, Area, Resource, Shift
{% include-markdown 'includes/pages/dashboards_filter_options.md' %}