---
alias: user-guide-business-intelligence-dashboard-production-order-fulfillment
grafana_json: Library/Build/ConfigFiles/Grafana/MES/dashboards/ProductionOrderFulfillment.json
tags:
- dashboards
- production order
description: "This dashboard provides insights on the production order fulfillment, helping monitoring shipment timelines and identifying potential delays"
---
# Production Order Fulfillment
## Overview
The **Production Order Fulfillment** dashboard provides a detailed overview of how current production progress aligns with planned expectations. It allows users to monitor estimated and actual ship-out dates, cycle time performance, and delays per production order and material.
The goal is to highlight whether orders will ship on time, early, or late, enabling proactive decision-making on the shop floor.
## Folder
Performance
## Database
* CDM (queried via OData)
## Data
### Dimensions
* Enterprise
* Site
* Facility
* Area
* Step
* Customer
* Production Order
* Material
* Product Group
* Product
* Primary Quantity
* Primary Units
* Secondary Quantity
* Secondary Units
### KPIs
* Cycle Time To Date (CT_td)
* Planned Cycle Time To Date (pCT_td)
* Planned Cycle Time To End (pCT_te)
* Cycle Time Ratio (CT Ratio)
* Critical Ratio (C/R)
* Estimated Ship Out Date (eSoD)
* Ship Out Date (SoD)
* Ship Out Date Status (SoD Status)
* Estimated Delay (eDelay)
## Example
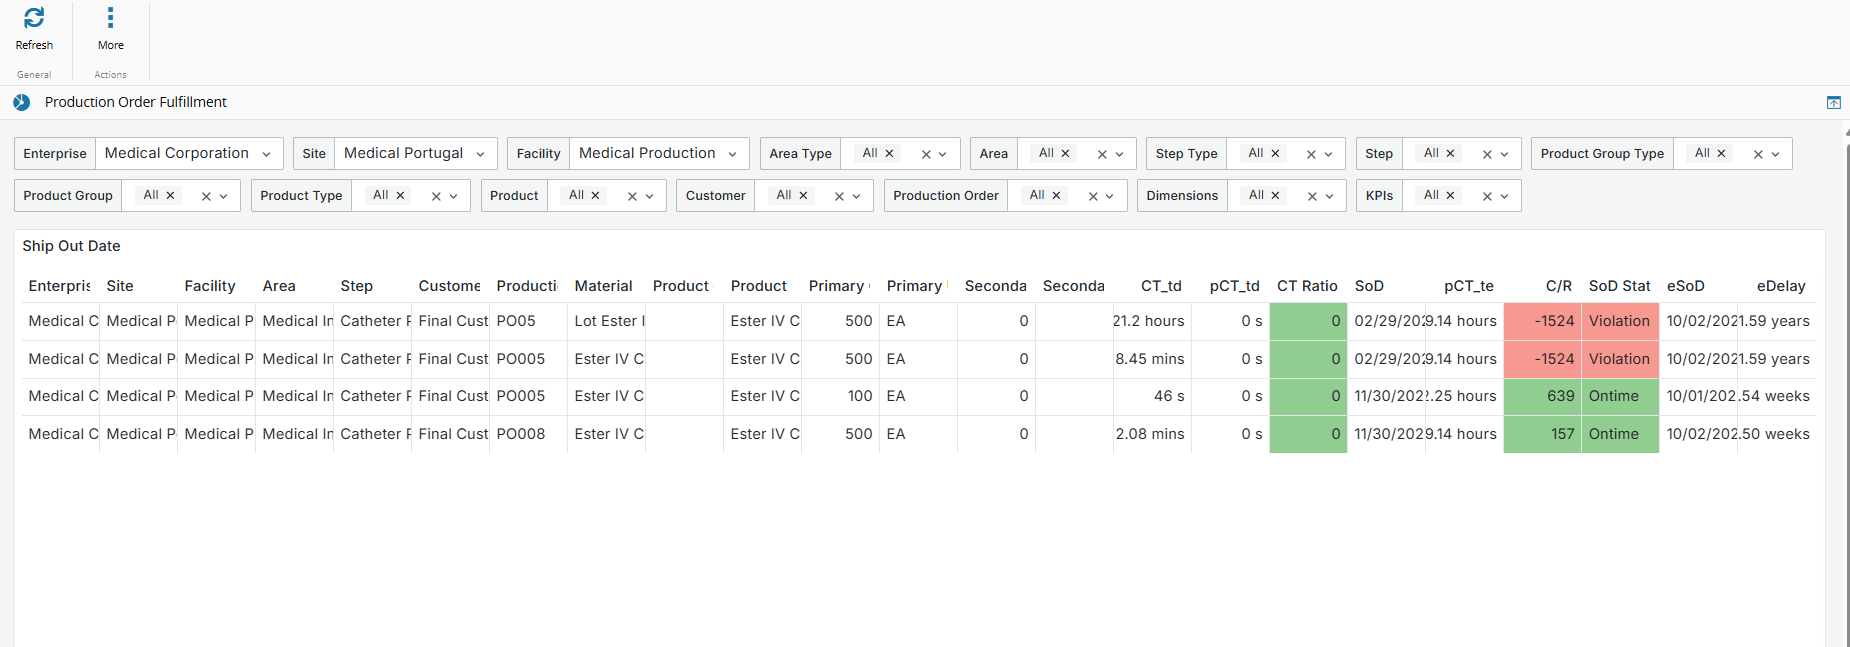
## Data Visualization
| Column | Description | Threshold Values | Data Source |
| ---------------------- | ----------------------------------------------------- | ----------------- | ---------------------------- |
| **Enterprise** | Name of the enterprise. | | [[dataplatform-dataset-shipoutdate]] |
| **Site** | Name of the site. | | [[dataplatform-dataset-shipoutdate]] |
| **Facility** | Name of the facility. | | [[dataplatform-dataset-shipoutdate]] |
| **Area** | Name of the area. | | [[dataplatform-dataset-shipoutdate]] |
| **Step** | Name of the process step. | | [[dataplatform-dataset-shipoutdate]] |
| **Customer** | Name of the customer associated with the production order. | | [[dataplatform-dataset-shipoutdate]] |
| **Production Order** | Identifier of the production order. | | [[dataplatform-dataset-shipoutdate]] |
| **Material** | Name or ID of the material. | | [[dataplatform-dataset-shipoutdate]] |
| **Product Group** | Group/category the product belongs to. | | [[dataplatform-dataset-shipoutdate]] |
| **Product** | Product being produced. | | [[dataplatform-dataset-shipoutdate]] |
| **Primary Quantity** | Quantity measured in primary units. | | [[dataplatform-dataset-shipoutdate]] |
| **Primary Units** | Units used for the primary quantity. | | [[dataplatform-dataset-shipoutdate]] |
| **Secondary Quantity** | Quantity measured in secondary units. | | [[dataplatform-dataset-shipoutdate]] |
| **Secondary Units** | Units used for the secondary quantity. | | [[dataplatform-dataset-shipoutdate]] |
| **Cycle Time To Date (CT_td)**| The actual time that the production order has spent in the manufacturing process up to the current day. Used to track real-time progress on the shop floor.| |[[dataplatform-dataset-shipoutdate]] |
| **Planned Cycle Time To Date (pCT_td)**| The expected (planned) time the production order should have taken by today, based on predefined routing or scheduling data.| |[[dataplatform-dataset-shipoutdate]] |
| **Cycle Time Ratio (CT Ratio)**| Indicates whether production is ahead or behind schedule by comparing actual vs. planned cycle time to date. When CT is above 1 it indicates a delay.| - Green: CT Ratio < 1
- Yellow: 1 CT Ratio < 1.2
- Red: CT Ratio ≥ 1.2 | [[dataplatform-dataset-shipoutdate]] |
| **Planned Cycle Time To End (pCT_te)**| The remaining planned time (from today until the ship-out date) needed to complete the order, assuming no delays.| |[[dataplatform-dataset-shipoutdate]] |
| **Critical Ratio (C/R)** | Measures schedule urgency by comparing the time left until the planned ship-out date vs. the remaining processing time. When C/R is below 1 it indicates the risk of delay. | - Red: C/R < 0.8
- Orange: 0.8 ≤ C/R Ratio < 1.0
- Yellow: 1.0 ≤ C/R Ratio < 1.2
- Green: C/R Ratio ≥ 1.2 | [[dataplatform-dataset-shipoutdate]] |
| **Estimated Ship Out Date (eSoD)**| The projected date the order will leave the production line, based on current progress and delays.| | [[dataplatform-dataset-shipoutdate]] |
| **Ship Out Date (SoD)** | The scheduled (planned) date for the order to be shipped. Typically defined by customer delivery agreements or internal scheduling. | |[[dataplatform-dataset-shipoutdate]] |
| **Ship Out Date Status (SoD Status)**| Highlights if the order is on track or at risk. Calculated by comparing the estimated vs. planned ship-out dates. | - Green: SoD Status = Ontime
- Yellow: SoD Status = Monitor
- Orange: SoD Status = Delayed
- Red: SoD Status = Violation
| [[dataplatform-dataset-shipoutdate]] |
| **Estimated Delay (eDelay)** | Time difference between the planned and estimated ship-out date. When eDelay is positive it indicates that the order is delayed. | | [[dataplatform-dataset-shipoutdate]] |
## Entity Filters
### Single selection
* Enterprise
* Site
* Facility
### Multiple / All selection
* Area
* Step
* Product Group Type
* Product Group
* Product Type
* Product
* Material
* Customer
* Production Order
* Dimensions
* KPIs
{% include-markdown 'includes/pages/dashboards_filter_options.md' %}